March 17, 2017, 4:00pm EST               Invest Alongside Billionaires For $297/Qtr

With the Fed’s third rate hike this week in the post-financial crisis era, let’s take a look at how market rates have reponded.

Here’s a chart of the U.S. 10 year government bond yield.


On December 16, 2015, the Fed moved for the first time.  The 10-year traded up to 2.33% that day and didn’t see that level again for 11-months.  Despite the fact that the Fed forecasted four hikes over the next twelve months, the bond market wasn’t buying it.  A month later, the fall in oil prices turned into a crash.  And the 10 year yield printed a new record low at 1.32%, just under the crisis lows.

On December 14, 2016, the Fed made the second move. This was after they had spent the better part of the last nine months walking back on what they thought would be their 2016 hiking campaign.  The difference?  Trump was elected the new President and he was already fueling confidence from talk of big, bold fiscal stimulus.  The Fed’s big hiking campaign was placed back on the table.  The high in yields the day the Fed made hike #2 was 2.58%.  The next day it put in a top at 2.64% that we have not seen since.

And, of course, this past week, we’ve had hike #3.  The 10 year yield traded up to 2.60% that day (Wednesday) and we haven’t seen it since, despite the fact that the Fed has continued to tell us another couple of hikes this year, and that the economy is doing well, expect about three hikes a year through 2018. Yields go out at 2.50% today.

So why aren’t market rates screaming?  The 10 year yield should be 3.5%+ by now.  And consumer rates should be surging.  Is it the Bank of Japan, the European Central Bank and China buying our Treasuries, keeping a cap on yields?  Is it that the market doesn’t believe it and thus the yield curve is flattening (which would project recession)?  Probably a bit of both. The important point is that the Fed absolutely cannot do what they are doing if they think they will push the 10 year yield up to 3.5%+, and fast.

In our Billionaire’s Portfolio, we’re positioned in a portfolio of deep value stocks that all have the potential to do multiples of what broader stocks do — all stocks owned and influenced by the world’s smartest and most powerful billionaire investors.  Join us today and we’ll send you our recently recorded portfolio review that steps through every stock in our portfolio, and the opportunities in each.  ​


February 7, 2017, 4:00pm EST                                                                                 Invest Alongside Billionaires For $297/Qtr

Yesterday we looked at the slide in yields (U.S. market interest rates — the 10-year Treasury yield).  That continued today, in a relatively quiet market.

Let’s take a look at what may be driving it.

If you take a look at the chart below, you can see the moves in yields and gold have been tightly correlated since election night: gold down, yields up.

As markets began pricing in a wave of U.S. growth policies, in a world where negative interest rates were beginning to emerge, the benchmark market-interest-rate in the U.S. shot up and global interest rates followed.  The German 10-year yield swung from negative territory back into positive territory.  Even Japan, the leader of global negative interest rate policy early last year, had a big reversal back into positive territory.

And as growth prospects returned, people dumped gold.  And as you can see in the chart above of the “inverted price of gold,” the rising line represents falling gold prices.
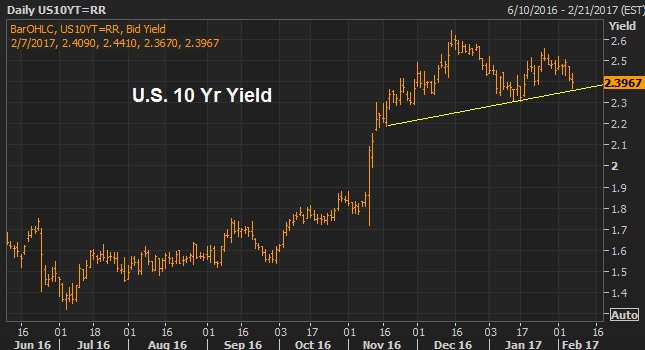
Interestingly, gold has been bouncing pretty aggressively since mid December. Why?  To an extent, it’s pricing in some uncertainty surrounding Trump policies. And that would also explain the slow down and (somewhat) slide in U.S. yields.  In fact, based on that chart above and the gold relationship, it looks like we could see yields back below 2.10%. That would mean a break of the technical support (the yellow line) in this next chart …

Another reason for higher gold, lower yields (i.e. higher bond prices), might be the capital flight in China. Where do you move money if you’re able to get it out in China?  The dollar, U.S. Treasuries, U.S. stocks, Gold.

The data overnight showed the lowest levels reached in the countries $3 trillion currency reserve stash in 6 years.  That, in large part, comes from the Chinese central banks use of reserves to slow the decline of their currency, the yuan. Of course a weakening yuan only inflames U.S. trade rhetoric.

For help building a high potential portfolio for 2017, follow me in our Billionaire’s Portfolio, where you look over my shoulder as I follow the world’s best investors into their best stocks.  Our portfolio more than doubled the return of the S&P 500 in 2016.  You can join me here and get positioned for a big 2017.