July 5, 5:00 pm EST
I hope everyone had a great Fourth of July yesterday. Today, the markets continue to be thinly traded as we head into the jobs report tomorrow.
We did get minutes from the recent Fed meeting today. This is a closer look into the views of the Fed from their June meeting. Of course, we already had a lot of information from that June meeting: the Fed hiked rates for the second time this year, they telegraphed an additional hike for the year in their projections, plus the June meeting was also accompanied by a press conference from Fed chair Jay Powell. And his explicit “main takeaway” was … “the economy is doing very well.”
With this in mind, as we head into tomorrow’s jobs numbers, the 10-year yield is probably the most important chart to watch. While inflation isn’t near reflecting an economy that’s running hot, the interest rate market is even more disconnected.
Remember, back on May 18, in my Pro Perspectives note, we discussed this chart …
|
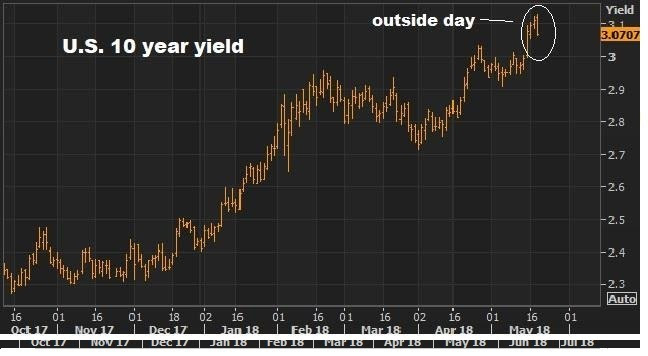 |
As the world was becoming concerned with the speed and level of market interest rates, we had this big technical reversal signal hit for the key 10-year government bond yield.
We focused on this in my May 18th piece, where I said “this technical phenomenon, when closing near the lows, is a very good predictor of tops and bottoms in markets, especially with long sustained trends.” And I said, “I suspect we may have seen some global central bank buyers of our Treasuries today (which puts downward pressure on yields) to take a bite out of the momentum.”
Today the chart looks like this …
|
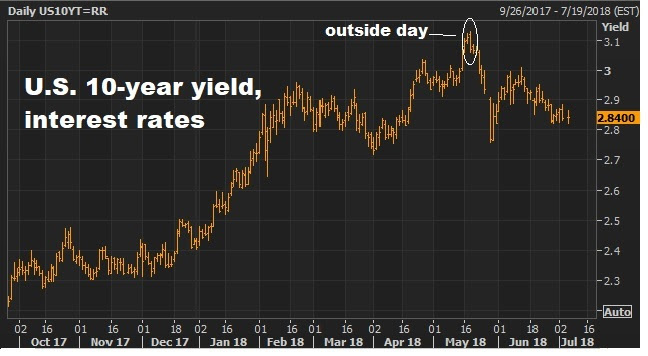 |
So, that outside day did indeed predict a reversal. And we head into tomorrow’s job report with the benchmark 10-year yield at just 2.84%. That’s in a world where the economy is running at 3% growth and unemployment is under 4%.
But this disconnect may be changing tomorrow. The key data point tomorrow will be wages (Average Earning), not jobs. A hot number there will likely turn this around, and bring higher rates back into the picture.
If you haven’t joined the Billionaire’s Portfolio, where you can look over my shoulder and follow my hand selected 20-stock portfolio of the best billionaire owned and influenced stocks, you can join me here.
|
July 13, 2017, 4:00 pm EST Invest Alongside Billionaires For $297/Qtr
 With some global stock barometers hitting new highs this morning, there is one spot that might benefit the most from this recently coordinated central bank promotion of a higher interest environment to come. It’s Japanese stocks.
First, a little background: Remember, in early 2016, the BOJ shocked markets when it cut its benchmark rate below zero. Counter to their desires, it shook global markets, including Japanese stocks (which they desperately wanted and needed higher). And it sent capital flowing into the yen (somewhat as a flight to safety), driving the value of the yen higher and undoing a lot of the work the BOJ had done through the first three years of its QE program. And that move to negative territory by Japan sent global yields on a mass slide.
By June, $12 trillion worth of global government bond yields were negative. That put borrowers in position to earn money by borrowing (mainly you are paying governments to park money in the “safety” of government bonds).
The move to negative yields, sponsored by Japan (the world’s third largest economy), began souring global sentiment and building in a mindset that a deflationary spiral was coming and may not be leaving, ever—for example, the world was Japan.
And then the second piece of the move by Japan came in September. It was a very important move, but widely under-valued by the media and Wall Street. It was a move that countered the negative rate mistake.
By pegging its ten-year yield at zero, Japan put a floor under global yields and opened itself to the opportunity to doing unlimited QE. They had the license to buy JGBs in unlimited amounts to maintain its zero target, in a scenario where Japan’s ten-year bond yield rises above zero. And that has been the case since the election.
The upward pressure on global interest rates since the election has put Japan in the unlimited QE zone — gobbling up JGBs to push yields back down toward zero — constantly leaning against the tide of upward pressure. That became exacerbated late last month when Draghi tipped that QE had done the job there and implied that a Fed-like normalization was in the future.
So, with the Bank of Japan fighting a tide of upward pressure on yields with unlimited QE, it should serve as a booster rocket for Japanese stocks, which still sit below the 2015 highs, and are about half of all-time record highs — even as its major economic counterparts are trading at or near all-time record highs.

June 2, 2017, 3:30pm EST Invest Alongside Billionaires For $297/Qtr
 Join the Billionaire’s Portfolio to hear more of my big picture analysis and get my hand-selected, diverse stock portfolio following the lead of the best activist investors in the world.As we end the week, we have some remarkable market and economic conditions. U.S. stocks printing new record highs by the day. Yields today broke down. The 10 year yield now trades 2.15%. Oil is under $50.We’re set up to massively stimulative fiscal policies launch into an economic environment that is about as primed as it can possibly get.The stock market is at record highs. The unemployment rate is 4.3%. Inflation is low. Gas is cheap ($2.38), and stable. Mortgage rates are under 4%, and stable. You can borrow money at 2% (or less) to buy a car. Join the Billionaire’s Portfolio to hear more of my big picture analysis and get my hand-selected, diverse stock portfolio following the lead of the best activist investors in the world.As we end the week, we have some remarkable market and economic conditions. U.S. stocks printing new record highs by the day. Yields today broke down. The 10 year yield now trades 2.15%. Oil is under $50.We’re set up to massively stimulative fiscal policies launch into an economic environment that is about as primed as it can possibly get.The stock market is at record highs. The unemployment rate is 4.3%. Inflation is low. Gas is cheap ($2.38), and stable. Mortgage rates are under 4%, and stable. You can borrow money at 2% (or less) to buy a car.
This has all put consumers in as healthy a position as they’ve been in a long time.
As I’ve said, the two key tools the Fed used to engineer a recovery was housing and stocks. That restores wealth, which restores confidence, which gets people spending, hiring and investing again. So stocks are at record highs. And housing (as you can see in the chart below) continues to climb back toward pre-crisis levels.

As a result, we have well recovered and surpassed pre-crisis levels in household net worth, and sit at record highs …

What is the key long-term driver of economic growth over time? Credit creation. In the next chart, you can see the sharp recovery in consumer credit (in orange) since the depths of the economic crisis. This excludes mortgages. And you can see how closely GDP (the purple line, economic output) tracks credit growth.

So credit is back on track. Meanwhile, consumers have never been so credit worthy. FICO scores in the U.S. have reached all-time highs.
With all of this said, the consumer looks strong, but the big missing link and structural drag on the economy in this story has been wage growth. What’s the solution? A corporate tax cut. The biggest winners in a corporate tax cut are workers. The Tax Foundation thinks a cut in the corporate tax rate would double the current annual change in wages.
So think about this backdrop. If I told you at any point in history that these were the conditions, you would probably tell me that the economy was already in, or will be in, an economic boom period. I think it’s coming. And it will drive earnings significantly, which will make the valuation on stocks cheap.
What stocks are cheap? Join me today to find out what stocks I’m buying in my Billionaire’s Portfolio. It’s risk-free. If for any reason you find it doesn’t suit you, just email me within 30-days. |
May 19, 2017, 4:00pm EST Invest Alongside Billionaires For $297/Qtr
| Stocks continue to bounce back today. But the technical breakdown of the Trump Trend on Wednesday
still looks intact. As I said on Wednesday, this looks like a technical correction in stocks (even considering today’s bounce), not a fundamental crisis-driven sell-off.
With that in mind, let’s take a look at the charts on key markets as we head into the weekend.
Here’s a look at the S&P 500 chart….
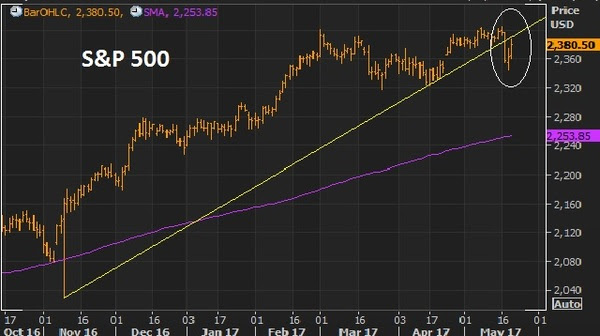
For technicians, this is a classic “break-comeback” … where the previous trendline support becomes resistance. That means today’s highs were a great spot to sell against, as it bumped up against this trendline.
Very much like the chart above, the dollar had a big trend break on Wednesday, and then aggressively reversed Thursday, only to follow through on the trend break to end the week, closing on the lows.
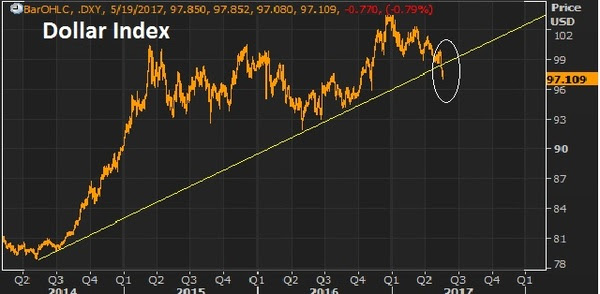
On that note, the biggest contributor to the weakness in the dollar index, is the strength in the euro (next chart).
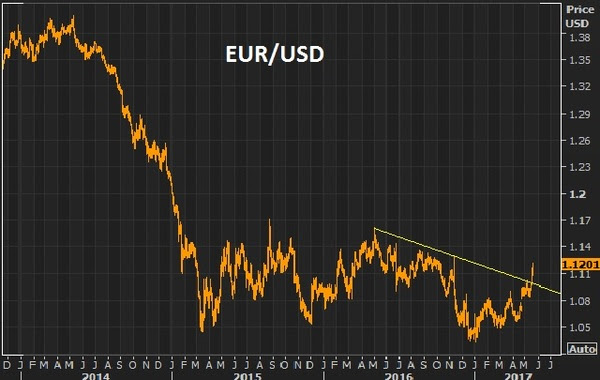
The euro had everything including the kitchen sink thrown at it and it still could muster a run toward parity. If it can’t go lower with an onslaught of events that kept threatening the existence of the euro, then any sign of that clearing, it will go higher. With the French elections past, and optimism that U.S. growth initiatives will spur global growth (namely recovery in Europe), then the European Central Bank’s next move will likely be toward exit of QE and extraordinary monetary policies, not going deeper. With that, the euro looks like it can go much higher. That means a lower dollar. And it means, European stocks look like, maybe, the best buy in global stocks.
A lower dollar should be good for gold. As I’ve said, if Trump policies come to fruition, inflation could get a pop. And that’s bullish for gold. If Trump policies don’t come to fruition, the U.S. and global growth looks grim, as does the post-financial crisis recovery in general. That’s bullish for gold.
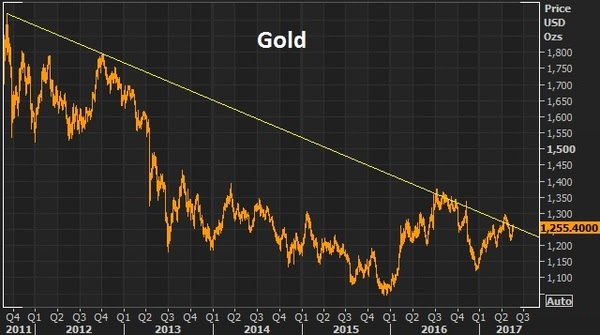
This big trendline in gold continues to look like a break is coming and higher gold prices are coming.
With all of the above, the most important chart of the week is probably this one …
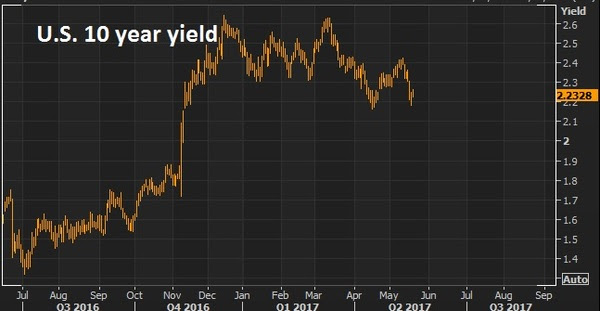
The 10 year yield has come all the way back to 2.20%. The best reason to wish for a technical correction in stocks, is not to buy the dip (which is a good one), but so that the pressure comes out of the interest rate market (and off of the Fed). The run in the stock market has clearly had an effect on Fed policy. And the Fed has been walking rates up to a point that could choke off the existing economic recovery momentum and, worse, neutralize the impact of any fiscal stimulus to come. Stable, low rates are key to get the full punch out of pro-growth policies, given the 10 year economic malaise we’re coming out of. Invitation to my daily readers: Join my premium service members at Billionaire’s Portfolio to hear more of my big picture analysis and get my hand-selected, diverse portfolio of the most high potential stocks.
|
February 22, 2017, 4:30pm EST Invest Alongside Billionaires For $297/Qtr
We had new record highs again in the Dow today. But remember, yesterday we talked about this dynamic where stocks, commodities and the dollar were strong. But a missing piece in the growing optimism about growth has been yields.
Clearly the 10 year at 2.40ish is far different than the pre-election levels of 1.75%-1.80%. But the extension was quick and has since been a non-participant in the full-on optimism vote given across other key markets.
Why? While stocks can get ahead of better growth, yields can’t in this environment. Higher stocks can actually feed higher growth. Higher yields, on the other hand, can kill it.
But there’s something else at work here. As we know Japan’s policy to target the their 10 year at zero provides an anchor to our interest rates, as the BOJ is in unlimited QE mode. Some of that freshly produced liquidity, and the money displaced by their bond buying, undoubtedly finds a happier home in U.S. Treasuries (with a rising dollar, and a 2.4% yield). That caps yields.
But in large part, the quiet drag on U.S. yields has also come from the rising risks in Europe. The election cycle in Europe continues to threaten a populist Trump-like movement, which is very negative for the European Union and for the survival of the single currency (the euro). That creates capital flight, which has been contributing to dollar strength and flows into the parking place of U.S. Treasuries (which pressures yields, which is keeping mortgage and other consumer rates in check).
These flows are also showing up clearly in the safest bond market in Europe: the German bunds. The 2-year German bund hit an all-time record LOW, today of -91 basis points. Yes, while the U.S. mindset is adjusting for the idea of a 3%-4% growth era, German yields are reflecting crisis and money is plowing into the safest parking place in Europe. The spread between German and French bonds are reflecting the mid-2012 levels when Italy and Spain where on the brink of insolvency — only to be saved by a bold threat/backstop from the European Central Bank.
We talked last week about the prospects for higher gold and lower yields as questions arise about the execution of (or speed of execution) Trump’s growth policies, some of the inflation optimism that has been priced in, may begin to soften. That would also lead to a breather for the stock market. I suspect we will begin to see the coming elections in Europe also contribute to some de-risking for the next couple of months. We already have a good earnings season and some solid economic data and optimism about the policy path priced in. May be time for a dip. But as I’ve said, it would create opportunities– to buy any dip in stocks, and sell any rally in bonds.
To peek inside the portfolio of Trump’s key advisor, join me in our Billionaire’s Portfolio. When you do, I’ll send you my special report with all of the details on Icahn, and where he’s investing his multibillion-dollar fortune to take advantage of Trump policies. Click here to join now.
February 7, 2017, 4:00pm EST Invest Alongside Billionaires For $297/Qtr
Yesterday we looked at the slide in yields (U.S. market interest rates — the 10-year Treasury yield). That continued today, in a relatively quiet market.
Let’s take a look at what may be driving it.
If you take a look at the chart below, you can see the moves in yields and gold have been tightly correlated since election night: gold down, yields up.

As markets began pricing in a wave of U.S. growth policies, in a world where negative interest rates were beginning to emerge, the benchmark market-interest-rate in the U.S. shot up and global interest rates followed. The German 10-year yield swung from negative territory back into positive territory. Even Japan, the leader of global negative interest rate policy early last year, had a big reversal back into positive territory.
And as growth prospects returned, people dumped gold. And as you can see in the chart above of the “inverted price of gold,” the rising line represents falling gold prices.
Interestingly, gold has been bouncing pretty aggressively since mid December. Why? To an extent, it’s pricing in some uncertainty surrounding Trump policies. And that would also explain the slow down and (somewhat) slide in U.S. yields. In fact, based on that chart above and the gold relationship, it looks like we could see yields back below 2.10%. That would mean a break of the technical support (the yellow line) in this next chart …
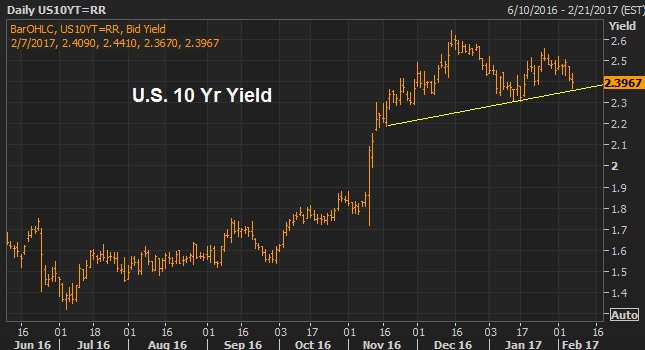
Another reason for higher gold, lower yields (i.e. higher bond prices), might be the capital flight in China. Where do you move money if you’re able to get it out in China? The dollar, U.S. Treasuries, U.S. stocks, Gold.
The data overnight showed the lowest levels reached in the countries $3 trillion currency reserve stash in 6 years. That, in large part, comes from the Chinese central banks use of reserves to slow the decline of their currency, the yuan. Of course a weakening yuan only inflames U.S. trade rhetoric.
For help building a high potential portfolio for 2017, follow me in our Billionaire’s Portfolio, where you look over my shoulder as I follow the world’s best investors into their best stocks. Our portfolio more than doubled the return of the S&P 500 in 2016. You can join me here and get positioned for a big 2017.
November 29, 2016, 5:15pm EST
Yesterday I talked about how an OPEC cut on oil production would/should accelerate the Fed’s plan for interest rate hikes next year.
Interestingly, the former Fed Chair himself, Ben Bernanke, wrote a post today on the internet talking about the Fed’s rate path and its quarterly projections (which we looked at yesterday).
Like his post in August, where he interpreted a shift in the Fed’s communications strategy for us, the media, which is always following the latest shiny object, didn’t pick up on it then, didn’t pick up on his message about the Bank of Japan’s actions in September, and has barely reported on his new post today (to this point).
When Bernanke speaks, for anyone that cares about the direction of markets, interest rates and the economy — we should all be listening.
Let’s talk about some of the nuggets Bernanke has offered in recent months, to those that are listening, through simple blog posts. And then we’ll look at what he said today.
Remember, this is the man with the most intimate knowledge of where the world has been over the past decade, what it’s vulnerable to, and what the probable outcomes look like for the global economy. He advises one of the biggest hedge funds in the world, the biggest bond fund in the world and one of the most important central banks in the world (the BOJ), and clearly still has a lot of influence at the Fed.
Back in August he wrote a piece criticizing the Fed for being too optimistic in its projections for the path of interest rates. He said that the Fed’s forward guidance of the past two years has led to a tightening in financial conditions, which has led to weaker growth, lower market interest rates and lower inflation. In plain English, consumers and businesses start playing defense if they think rates are on course to be dramatically higher, and that leads to lower inflation and lower growth. The opposite of the Fed’s desired outcome.
With that, Bernanke thought they should be taking the opposite approach, and suggested it may already be underway at the Fed (i.e. they should underestimate future growth and the rate path, and therefore possibly stimulate economic activity with that message).
It just so happens that Yellen has been speaking from this script ever since. They’ve ratcheted down expectations of the rate path, and in her more recent comments she’s said the Fed should let the economy run hot (to give it some momentum without bridling it with higher rates).
Then in September, after the BOJ surprised with some new wrinkles in their QE plan, Bernanke wrote a post emphasizing the importance of their new target of a zero yield on their 10 year government bond. The media and markets gave the BOJ’s move little attention. It was as if Bernanke was acting as the communications director for the BOJ.
He posted that day saying that the BOJ’s new policy moves were effectively a bigger QE program. Instead of telling us the size of purchase, they’re telling us the price on which they will either or buy or sell to maintain. He said, if the market decides to dump Japanese government bonds, the BOJ could end up buying more (maybe a lot more) than their current 80 trillion yen a year.
Bernanke also called the move to peg rates, a stealth monetary financing of government spending (which can be a stealth debt monetization). The market has indeed pushed bond prices lower since, which has pushed yields back above zero, and as Bernanke suggested, the BOJ is now in unlimited QE mode (buying unlimited amounts of bonds as long as the 10 year yield remains above a zero interest rate). That’s two for two for Bernanke interpreting for us, what looks like a complicated policy environment.
So what did he talk about today? Today he criticized Fed members for sending confusing messages about monetary policy through their frequent speeches and interviews that take place between Fed meetings. But most importantly, he seemed to be setting the table for another 180 from the Fed on their economic projections at their December meeting.
Remember, they went from forecasting four hikes for 2016, to dialing it back dramatically just three months into the year. Now, with the backdrop for a $1 trillion fiscal stimulus package finally coming down the pike, to relieve monetary policy, the outlook has changed for markets, and likely the Fed as well.
With that, Bernanke seems to be trying to give everyone a little heads up, to reduce the shock that may come from seeing a Fed path, in it’s coming December projections, that may/will likely show expectations of more aggressive rate hikes next year — perhaps projecting four hikes again for the year ahead (as they did into the close of last year).
We may be entering an incredible era for investing. An opportunity for average investors to make up ground on the meager wealth creation and retirement savings opportunities of the past decade, or more. For help, follow me in my Billionaire’s Portfolio, where you look over my shoulder as I follow the world’s best investors into their best stocks. Our portfolio is up 24% year to date. That’s more than three times the performance of the broader stock market. Join me here.


 With some global stock barometers hitting new highs this morning, there is one spot that might benefit the most from this recently coordinated central bank promotion of a higher interest environment to come. It’s Japanese stocks.
 Join the


