February 13, 5:00 pm EST

Over the past couple of days we’ve looked at some key technical levels for stocks, as we continue this V-shaped recovery from the deep decline of December.

We now sit just a percent and a half off of the December 3rd highs. And today, we get a break and a close above the 200-day moving average in the S&P 500.

So, with all of the doom and gloom scenarios we heard as we entered 2019, a month later and we’ve nearly fully recovered the losses of December.  And with expectations on earnings  and growth all ratcheted down now for the year, we have a lot of fuel for much higher stocks.

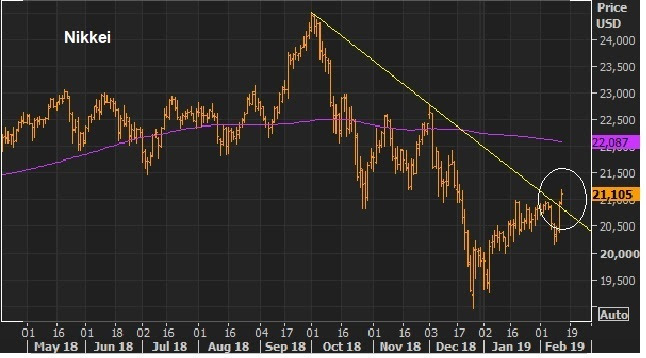
As U.S. stocks go, so do global stocks.  We looked at the chart on Japanese stocks yesterday.  We did indeed get a big technical break overnight of the correction downtrend that started in October of last year.

So, today we have this chart … 

With much of the concern on global growth directed squarely in China, this chart of Chinese stocks is signaling that perhaps Chinese growth is bottoming, and maybe because a U.S./China deal is coming.  

In this chart above, you can see this bear market in Chinese stocks last year was started in January.  That was when Trump rhetoric on a China trade war turned into action.  He slapped tariffs on washing machines and solar panels (a signal of bark and bite).  Now we have a bottom, as of last month, and a big technical break of the downtrend, arguably leading the patterns we’re seeing in U.S. and Japanese stocks.  For how you can play it:  Here are some ETFs that track Chinese stocks.

Join me here to get my curated portfolio of 20 stocks that I think can do multiples of what broader stocks do, coming out of this market correction environment.

February 12, 5:00 pm EST

Yesterday we talked about the big trend break in the S&P 500 and the big 200-day moving average hurdle, above.  Today we closed right on that 200-day moving average.

Here’s an update of the chart …


With this momentum, the chart tonight to watch is in Japan.  Here’s a look at Japanese stocks.  

As you can see, U.S. stocks have broken the downtrend of the past quarter, but Japanese stocks have yet to follow.  The Nikkei remains 15% off of the highs of October.  But with the strength in U.S. stocks today, we may get the breakout in Japanese stocks tonight, ahead of Japanese Q4 GDP (which is due tomorrow night). These are some ETFs that track the Nikkei. We own DBJP in my Forbes Billionaire’s Portfolio, an ETF that tracks the dollar-denominated Nikkei.  

Join me here to get my curated portfolio of 20 stocks that I think can do multiples of what broader stocks do, coming out of this market correction environment.

February 9, 5:00 pm EST

It’s a fairly light data week this week.  And we’re in the final stretch of Q4 earnings season, which has been good, despite a bad stock market for the quarter.

As for stocks, after a very huge bounce back in January, February has been flat.

But we’re working on this chart … 

As you can see, the S&P 500 has broken out of the downtrend that started October 3rd, but has failed (thus far) at the 200-day moving average (the purple line).  That 2,742 level is a key area to overcome for a return back to the levels of December 3.  That would complete this V-shaped recovery (about 3.5% higher than current levels).

Mnuchin and Lighthizer are in China this week.  So we’ll get more information on the U.S./China trade front.  However, it now looks like the March 1 trade truce deadline will be pushed back.  And maybe the whole thing culminates with a meeting between Trump and Xi at Mar-A-Lago next month.

Perhaps a good signal, after the holiday week in China for the Lunar New Year, Chinese stocks opened the week strong.  The index that tracks smaller cap stocks and higher risk tech names jumped 3.5%, for the biggest two day gain since early October.  Broad stocks in China are now up 9% from the January lows.

Join me here to get my curated portfolio of 20 stocks that I think can do multiples of what broader stocks do, coming out of this market correction environment.

February 8, 5:00 pm EST

Let’s take a look at some key charts as we end the week.

As we discussed yesterday, we had growth downgrades from Europe this week, and it was driven by the worst case scenarios of a no-deal on Brexit, and/or a continued stalemate/no deal on U.S. China trade.

Let’s see how that’s being interpreted in the key global interest rate markets.

First, we should acknowledge that the big swing in global economic sentiment was driven by the optimism surrounding the 2016 elections (i.e. a pro-growth U.S. President).

That gave us a sharp rise in global interest rates, and a sharp rise in global stock markets.  But now some of the air has been taken out of the optimism-balloon, and some big levels are being tested.

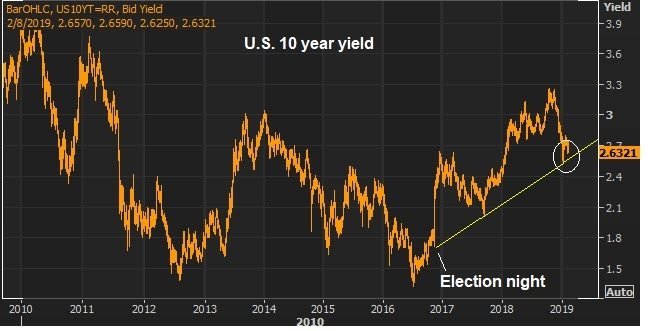
First, here’s a look at the U.S. 10-year yield.  On election night the 10-year was trading around 1.75%.  It has traded as high as 3.25% since.  But now we have this big line representing the rise from election night …


The 2.55% area is a big area for U.S. rates.

And in Germany, the German 10-year yield has returned to pre-Trump levels this week. 

After a decade of global QE, loads of global fiscal stimulus and countless backstops/intervention, lending your money to the German government for 10 years (the strongest economy in the euro zone) will pay you 9 basis points a year.
So, the interest rate market sits on critical levels heading into next week.
While a lot of attention by global politicians has been given to U.S. policy, this should be a clear signal to eurozone politicians to stop relying on the ECB, and to take some aggressive action to stimulate the economy (i.e. fiscal stimulus and structural reform).
Still, the move in rates looks well overdone.  Probably a good time to sell bonds – looking for rates to move higher from here.
Join me here to get my curated portfolio of 20 stocks that I think can do multiples of what broader stocks do, coming out of this market correction environment.

February 7, 5:00 pm EST

Downgrades on growth today weighed on global markets.

First, the European Commission slashed growth expectations for 2019 for all the major euro economies. For the EU overall, they are looking for 1.3% growth, versus 1.9% a few months ago.

Next up was the Bank of England decision on rates this morning.  They left rates unchanged, but downgraded growth for ’19 and ’20.  Keep in mind, this all incorporates the reset of expectations on global interest rates that have taken place over the past month (i.e. acommodative and staying that way).

So, why the downgrades? It’s all driven by fears of the worst case scenario on Brexit and U.S./China trade negotations.  That worst case scenario would be “no deal.”

Importantly, if we get these deals, the upgrades will come, quickly.

For the moment, though, we’re continuing to see an environment that looks much like 2016.  Central banks responded to the crash in oil prices by resetting expectations on monetary policy (easier).  And then the growth downgrades followed.

By the end of 2016, the U.S. election had swung sentiment from pessimism to optimism, and the growth upgrades came in — the Fed actually raised rates before the year-end.

I suspect if the fog of uncertainty clears, we will see the same.  But in the meantime, promoting the worst case scenario for growth may get policymakers in Europe motivated to follow the lead of the U.S. with some needed fiscal stimulus.  That would be good for European and global growth.


Join me here to get my curated portfolio of 20 stocks that I think can do multiples of what broader stocks do, coming out of this market correction environment.
.

February 6, 5:00 pm EST

Trump’s State of the Union address last night telegraphed the next priority in his economic plan:  Infrastructure.

Just two years in, this has become one of the final pillars of his Trumponomics plan, yet to be executed on.

Remember, when Trump took office he quickly went to work on reversing regulations that were stifling industries.  By the end of 2017, we got big tax cuts, which included incentives for companies to repatriate trillions of dollars of money held offshore.  And, of course, the fight for “fair trade” is ongoing, and maybe close to a resolution.

With these pro-growth policies, we have an economy that has finally escaped the decade-long rut of sub-2% growth.  We’ve returned to long-term trend growth (3%+).

So things look good, but we’ve yet to get the big kicker of an infrastructure spend. This is where we could see a real economic boom kick in.

And a split Congress is thought to be supportive of an infrastructure plan.  We’ve heard the Trump plan, which is $1.5 trillion funded through a private/public partnership.  After the Democrats won the house they said infrastructure would be high on the party’s agenda.  Back in March, the Democratic Senators proposed a $1 trillion plan.

If we get it, a big infrastructure spend could finally give us the big bounce back we typically see after a recession (i.e. some very big numbers).

Remember, the recovery of the past decade was manufactured by central banks.  The monetary stimulus and central bank intervention was good enough to keep the patient alive, but not to restore the global economy back to sustained, trend-growth. So we needed fiscal stimulus.  And we’ve gotten it.  But we’ve yet to see the type of big bounce back in growth typical of a post-recession recovery.

For context, in the left column of the table below, you can see the GDP numbers following the Great Depression.  And on the right, you can see the growth of the post-Great Recession (pre-Trump).

FBP_122717.jpg


Join me here to get my curated portfolio of 20 stocks that I think can do multiples of what broader stocks do, coming out of this market correction environment.

February 5, 5:00 pm EST

We’ve now heard from about half of the S&P 500 companies on Q4 earnings.  And about 70% of those companies have beat Wall Street’s earnings estimates.

We’ve heard from the banks, early on, which broadly painted the picture of a healthy economy.  And now we’ve heard from the dominant tech giants/ disrupters of the past decade.

Facebook beat.  Amazon beat.  Google beat.

But times are changing.

Remember, the regulatory screws have tightened on the tech giants over the past year.  It was a matter of when the market would finally price OUT the idea that these industry killers would be left unchallenged, to become monopolies.

With that in mind, back in early October, when market risks were building (from China, to interest rates, to Italy, to Saudi Arabia), we looked at this big and vulnerable trendline in Amazon.


Here’s the chart on Amazon now …

The break of that line gave way to a 30% plunge in what was the biggest company in the world.

Bottom line:  Amazon, Facebook and Google have entered into regulatory purgatory — after being largely left alone for the past decade to nearly destroy industries with little-to-no regulatory oversight.  Costs are going UP and will keep going up..

With all of this said, the stocks of these tech giants might take a breather, but given their scale and maturity, more regulation actually strengthens their moat.  There will never be a competitor to Facebook emerging from a dorm room or garage. The compliance costs will be too high.

Join me here to get my curated portfolio of 20 stocks that I think can do multiples of what broader stocks do, coming out of this market correction environment.

February 4, 5:00 pm EST

U.S. stocks are being valued right at the long-term P/E, just under 16x forward earnings.  And remember, that’s in an ultra-low interest rate environment (still).

Historically, in low rate environments stocks trade north of 20 times earnings.  With the Fed now on hold, and the 10-year yield back below 3%, if we continue to see this sweet spot of good economic activity and subdued inflation, we should see this multiple on stocks expand toward 20 this year.

If we multiply Wall Street’s 2019 earnings estimate on the S&P 500 ($172) times a P/E of 20, we get 3,440 in the S&P 500. That’s 26% higher than current levels.

Now, stocks in the U.K., Germany and Japan are all trading closer to 12x forward earnings. That’s cheap relative to long-term averages, and especially cheap relative to U.S. stocks. For perspective, Japanese stocks are recovering back toward the highest levels in more than 25 years, yet the forward P/E on Japanese stocks is closer to the lowest levels over the period.

From a technical perspective, Japanese stocks should follow the lead of this big trend break in U.S. stocks…


Here’s a look at the Nikkei and the opportunity to see this “laggard” catch up …

Join me here to get my curated portfolio of 20 stocks that I think can do multiples of what broader stocks do, coming out of this market correction environment.

January 29, 5:00 pm EST

Today let’s take a look at the recent moves the U.S. administration has made against Venezuela, and what that means for oil prices.

It was August of 2017, when Trump first stepped up pressure on Venezuela.  Venezuela is (and has been) in a humanitarian, political and economic crisis–led by what the U.S. administration has officially called a dictator. Trump slapped sanctions on the Venezuelan President back in 2017 (freezing his U.S assets) and was said to be considering broad oil sanctions. That finally came yesterday (seventeen months later).

For a country that relied heavily on oil exports (ninety-five percent of export revenues in Venezuela come from oil), the U.S. will no longer be sending money to Venezuela for oil.

This is a crushing blow for an already suffering country.

What does it mean for oil prices?

Venezuela has the world’s largest oil reserves. With oil sanctions, should come supply disruptions for the oil market, which could likely send oil aggressively higher.

Back in 2017, when Trump threatened sanctions, oil broke out of its $40-$55 range, and ultimately traded up to $76.

Today, we’re nearing the top end of that same range.

Join me here to get my curated portfolio of 20 stocks that I think can do multiples of what broader stocks do, coming out of this market correction environment.

January 11, 5:00 pm EST

Trade talks with China came and went again this week without any notable progress, at least in the respective statements from both parties.

But the behavior of the Chinese currency tells a different story.

Remember, China controls the value of its currency.  They “fix” it every day. And they’ve been walking it higher.  That’s a big signal.

Here’s a look at the chart …

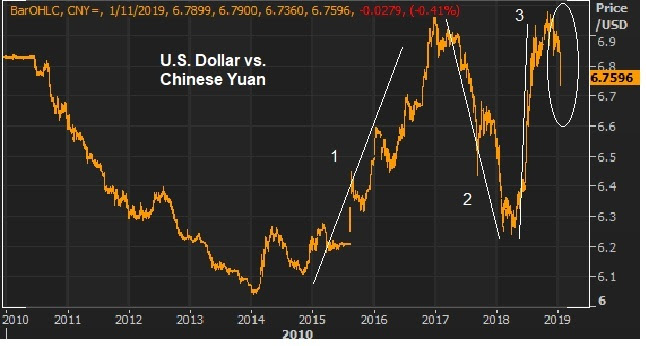
This chart shows the dollar/yuan exchange rate.  When the orange line is rising the dollar is strengthening, the yuan is weakening – and vice-versa.

You can see in 2015 and through 2016 (Line 1) the Chinese devalued the yuan by about 16% to respond to weak exports and sluggish growth.  When Trump was elected, he made it clear he would be coming after China for their cheap currency policies (i.e. manipulating the yuan to retain dominance in global exports).  With that, the Chinese strengthened the yuan in effort to stave off a trade war.  It didn’t work. And you can see in the most recent run up (Line 3) how they’ve responded.  They’ve gone back to weakening the currency.

Now, as we’ve discussed, the lower stock market has put pressure on the Trump agenda, which makes it more likely that some ground will be given on the demands that the U.S. has made on China.  So, with this backdrop in mind, how can Trump get to a deal on trade that gives him a win — and gives China an out, for the moment?  The Chinese currency could be a tool to get to an agreement – maybe China taking it back to 6 yuan per dollar in the near term.  

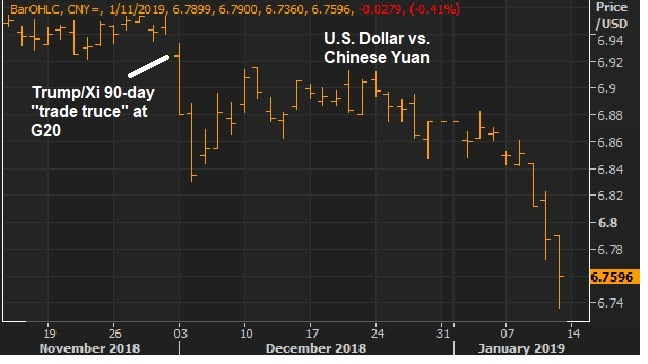
You can see in the shorter-term chart above, since Trump and Xi agreed to a 90-day period to get a deal done, the Chinese have been walking the yuan higher (which is shown in the falling line in the chart).
Join me here to get my curated portfolio of 20 stocks that I think can do multiples of what broader stocks do, coming out of this market correction environment.