June 11,  5:00 pm EST

Yesterday we talked about the surgical manipulation Trump is (seemingly) attempting to perform, to force the Fed’s hand on a rate cut — and therefore, to optimize the economy heading into the election.

At this stage, the harder he is on China, the lower stocks go, which puts more pressure on the Fed to cut rates.  But as the Fed has now signaled it’s prepared to act, stocks have risen, which makes it less likely that the Fed will act.

With that, yesterday, I surmised that Trump might ramp up the rhetoric as we near the June 19th Fed meeting, to keep a lid on the bounce in stocks.

On that note, Trump had some very firm comments on China trade this morning, implying he’s not willing to give any ground.  He says “we’re going to either do a great deal with China or we’re not doing a deal at all.”  He gets his demands, or no deal.  Again, as we discussed yesterday, he’s in the driver’s seat.  And he said as much today:  “It’s me right now that’s holding up the deal.”

Stocks have given some back today, after a six day rally from the lows of this recent correction.  And we get this chart going into the close…


As you can see, the S&P 500 put in a big technical reversal signal — a bearish outside day.  The last signal like this we observed was on May 1, which resulted in a 7.6% correction.  Perhaps we have a signal here of some softness in stocks to come, until we get to the June 19 Fed meeting.

If you haven’t signed up for my Billionaire’s Portfolio, don’t delay … we’ve just had another big exit in our portfolio, and we’ve replaced it with the favorite stock of the most revered investor in corporate America — it’s a stock with double potential.

Join now and get your risk free access by signing up here.

May 29, 5:00 pm EST

We’ve talked about the signal the interest rate market is giving: with rates at these levels, the bond market may force the Fed’s hand — forcing a June rate cut.

Still, the slide in the 10-year yield from 2.75 (in March) to 2.20 (the low today) is well overstating the risks in the global economy.  That’s more than 100 basis points off of the highs of just six months ago.  And the high to low of the last five trading days has been almost a full quarter point (23 basis points).  It makes no sense.

Many would assume it’s related due to the trade standstill.  But the IMF has only cut its growth estimate by 3/10ths of a percent from the tariff escalations.  That still projects a 3% growth from the global economy (much better than the average of the past 10-years).

Meanwhile, a U.S. 10-year and 2.20%, and German and Japanese yields well in negative territory are pricing in global recession (if not worse).  Is Japan buying U.S. Treasuries, and therefore pushing down global yields?  Maybe.

As we know, the slide in yields has weighed on confidence, and therefore stocks for the month of May.  But today, we ran into a huge technical level in the S&P 500 — the 200-day moving average.  And we had a big bounce.  I suspect we’ve seen the bottom of this move in stocks and yields.  We shall see. 


If you haven’t signed up for my Billionaire’s Portfolio, don’t delay … we’ve just had another big exit in our portfolio, and we’ve replaced it with the favorite stock of the most revered investor in corporate America — it’s a stock with double potential.

Join now and get your risk free access by signing up here.

April 29, 5:00 pm EST

We ended last week with a positive surprise for Q1 GDP.  Today, we had more soft inflation data.

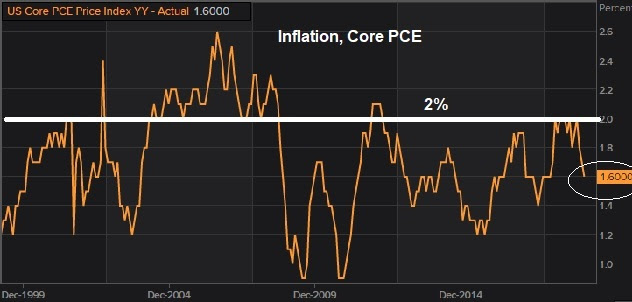
The Fed’s favored inflation gauge, core PCE, continues to fall away from it’s target of 2%.

Here’s a look at the chart …


With a Fed meeting this week, they remain in the sweet spot.  They have trend economic growth, subdued inflation and a 10-year yield at 2.5%.  They can sit and watch. They could cut!   That’s highly unlikely, but less unlikely by the summer, if current conditions persist.

The market is pricing in about a 60% chance that we’ll see a rate cut by year-end.  It doesn’t sound so crazy, if you consider that it would underpin/if not ensure the continuation of the economic expansion — perhaps even fueling an economic boom period.

Remember, we’ve talked about the 1994-1995 parallels. In 1994, an overly aggressive Fed raised rates into a recovering, low inflation economy.  By 1995, they were cutting.  That led to a 36% rise in stocks in 1995.  And it led to 4% growth in the economy through late 2000 — 18 consecutive quarters of 4%+ growth.  Stocks tripled over the five-year period.

This, as the S&P 500 is already sitting on new record highs?  As I said earlier this year, with yields back (well) under 3%, we should see multiples on stocks expand back toward 20x in this environment.

The forward 12-month P/E on the S&P 500 is currently 16.8.  If we multiply Wall Street’s earnings estimate on the S&P 500 ($175) times a P/E of 20, we get 3,500 in the S&P 500. That’s 19% higher than current levels.

But keep in mind, the earnings estimate bar has been set low.  And already 77% of companies are beating estimates on Q1 earnings.  I suspect, we’ll see higher earnings over the next twelve months than Wall Street has estimated, AND a higher multiple paid on those earnings (i.e. an outlook for an S&P 500 > 3,500).

If you haven’t signed up for my Billionaire’s Portfolio, don’t delay … we’ve just had another big exit in our portfolio, and we’ve replaced it with the favorite stock of the most revered investor in corporate America — it’s a stock with double potential.

Join now and get your risk free access by signing up here.

April 17, 5:00 pm EST

Last month we talked about Chinese stocks has a key spot to watch for: 1) are they doing enough to stimulate the struggling economy, and 2) (more importantly) are they taking serious steps to get to an agreement on trade with the U.S.?

The signal has been good.  Chinese stocks are up 34% since January 4th.

As I said back in March, Chinese stocks are reflecting optimism that a bottom is in for the trade war and for Chinese economic fragility.  That’s a big signal for the global (and U.S.) economy.

Fast forward a month, and we’re starting to see it (the bottoming) in the Chinese data.  Overnight, we had a better than expected GDP report.  And industrial output in China climbed at the hottest rate since 2014.

For those that question the integrity of the Chinese GDP data, many will look at industrial output and retail sales.  Retail sales had a better than expected number too overnight.  And the chart (too) looks like a bottom is in. 

Remember, by the end of last year, much of the economic data in China was running at or worse than 2009 levels (the depths of the global economic crisis).

The signal in stocks turned on the day that the Fed put an end to its rate hiking path AND when the U.S. and China re-opened trade talks (both on January 4th).

March 27, 5:00 pm EST

We’ve talked this week about the yield curve inversion.

In response, the market is now pricing in a better than 70% chance of a rate cut in June.  And Trump’s new pick to join the Fed, Stephen Moore, has said the Fed should cut by 50 basis points immediately.We’ve talked about the comparisons between 2019 and 1995.  In 1994 the Fed aggressively tightened into a low inflation, recovering economy (as they did in 2018).  By the middle of 1995, they were cutting.  Stocks finished the year up 36%.

Given the contrast of where the Fed has positioned themselves now, compared to just three months ago, they have effectively eased — and we can see it clearly manifested in the interest rate market.  The 10-year U.S. government bond yield has gone from 3.25% to under 2.5% since just November.  I would argue we already have a repeat of 1995.

Here’s a look, in the chart on the left, at what stocks did in 1994-1995, when the Fed transitioned from overtightening (into a low inflation, recovering economy) to easing.  And, on the right, this is how things look now, with similar context. 


Within a few quarters of the ’95 rate cut, U.S. growth was printing above 4% and did so for 18 consecutive quarters.  Stocks tripled over that period.

Join me here to get my curated portfolio of 20 stocks that I think can do multiples of what broader stocks do, through the end of the year.

March 26, 5:00 pm EST

Yesterday we talked about the yield curve inversion.

It was driven by the Fed walking up the fed funds rate (i.e. “normalizing rates”) over the course of the past three years.  As we discussed yesterday, with global central banks pinning down the long-end of the yield curve through QE (now led by the BOJ), there were few things better telegraphed than the U.S. yield curve inversion.

The market is now pricing in a 66% chance of a rate cut by the end of the year.  The market is arguing that the rate hike the Fed made in December, was a mistake.

When have we seen this script before?  1995.  As we discussed coming into the year, 2018 was the first year since 1994 that cash was the best producing major asset class (among stocks, real estate, bonds, gold).  And the culprit was an overly aggressive Fed tightening cycle in a low inflation recovering economy.

The Fed ended up cutting rates in 1995 and spurring a huge run up in stocks (up 36%).  That’s the bet people are making again.  But I suspect we’ve already seen the equivalent of a cut through the Fed’s dovish posturing since early January.  Remember, they went on a media blitz the first several days of January, dialing down expectations that there would be any more tightening.

Join me here to get my curated portfolio of 20 stocks that I think can do multiples of what broader stocks do, through the end of the year.

March 20, 5:00 pm EST

The Fed met today and confirmed the signaling we’ve seen since early January.

With the luxury of solid growth, low unemployment and subdued inflation, they have been signaling to markets, since January, that they will do nothing to rock the boat.  That move has restored confidence and stock prices (a reinforcing loop).

So, the Fed has gone from mechanically raising rates (as recently as December) to sitting on their hands.  And today they are forecasting no further rate hikes this year, and they are ending the unwind of their balance sheet in September (ending quantitative tightening).

This all looks like a move to neutral, but given the rate path they had been telegraphing up until the end of last year, this pivot is effectively easing — especially since these moves look like pre-emptive strikes against the potential of Brexit and U.S./China trade negotiations going bad.

With that, we have a big technical break in the bond market today.  The U.S. 10-year government bond yield (chart below) broke this important trendline today.


This trendline represents the “normalization” of market rates following the Trump election.  Following the election, with the optimism surrounding Trumponomics, the market started pricing OUT the slow post-recession economic growth rut, and pricing IN the chance that we could see a return to sustained trend growth.

So, what is it pricing in now?  I would say its pricing in the worst-case scenario – a no deal with China.

Join me here to get my curated portfolio of 20 stocks that I think can do multiples of what broader stocks do, coming out of this market correction environment.

March 19, 5:00 pm EST

We’ve seen the verbal and Twitter shots taken by Trump at the tech giants since he’s been in office.  And the threats have slowly been materializing as policy.

We get this today …


With this in mind, we’ve talked quite a bit about the domestic leveling of the playing field. The tech giants (Facebook, Amazon, Netflix, Google, Twitter …) are on the regulatory path to being held to a similar standard that their “old economy” competitors are held to.  They may have to pay for real estate (i.e. bandwidth). They may be scrutinized more heavily for anti-competitive practices.  And they may be liable for content on their site, regardless of who created it.

The latter was the subject of the Trump tweet today.  And he was asked about it in a press conference.  He said we “have to do something about it.”  He called the discrimination and bias “collusion” from the tech giants.

The regulation is coming. And depending on the degree, at best, it changes the business models of these “disrupters.” At worse, it could destroy them.  Imagine, Facebook and Twitter being held liable for things their customers are saying on their platforms.  That’s endless compliance to ward of business killing liabilities.

As compliance costs go UP for these companies.  The cost goes UP for consumers. The model is changed.

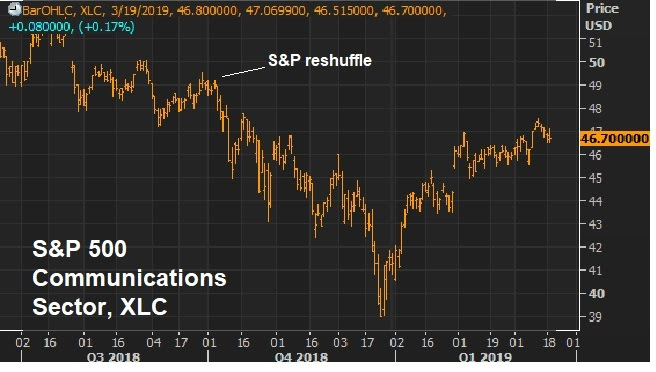
On a related note, remember, last September the S&P 500 reshuffled the big tech giants.  Among the changes, they moved Facebook, Google and Twitter out of the tech sector and in to the telecom sector (re-named the “Communications” sector”).

Here’s what that sector ETF looks like since …

Join me here to get my curated portfolio of 20 stocks that I think can do multiples of what broader stocks do, coming out of this market correction environment.

March 18, 5:00 pm EST

Stocks open the week in breakout mode.

We’ve now taken out the December highs, the levels that preceded the sharp 20% plunge.

So, now we have this chart as we enter a week with a Fed meeting on the agenda.


This leaves us up 13% on the year, and with another 4% climb to regain the October all-time highs.

The Fed meets this week.  With a relatively light data and news week, the Fed will get plenty of attention.  But remember, we know exactly where they stand.  They want to maintain confidence in the economy.  And they know the stock market is an important contributor (and can be a dangerous detractor) to confidence.  They need stocks higher.

That’s why on January 4th, the Fed responded to the plunging stock market by marching out the current and past two leaders of the Fed to tell us the “normalization phase” on interest rates was over (i.e. no more rate hikes).

And that’s why on March 10th (just a week ago), in response to a 4% one-day plunge in Chinese stocks and some loss of momentum in the U.S. stock market rebound, Powell followed the script of his predecessor Ben Bernanke, and spoke directly to the public through an exclusive 60 Minutes interview, to reassure the public that the economy was in good shape, and that the Fed was there to ensure stability.  If you bought stocks after both interviews, you felt no pain and have been rewarded handsomely.

With the above chart in mind, below is the chart we looked at to start the year, as we discussed the potential for a V-shaped recovery following the Fed’s January 4th strategic pivot.

From my January 4th Pro Perspectives note:
“We entered the year with the idea that the Fed would need to walk back on its rate hiking path this year (possibly even cutting, if the stock market environment persisted).  And today, just days into the new year, we get the Fed Chair Powell, former Fed Chairs Yellen and Bernanke telling us that the Fed is essentially done of the year, unless things improve … [as for stocks] We broke a big level today on the way up in the S&P 500 (2520) and it looks like a V-shaped recovery is underway, to take us back to where stocks broke down on December 3rd.  That would be 12% from current levels.” So, far so good. The Fed has stabilized confidence.  The question now is, do we get a deal with China soon?  If not, we may find a rate cut, in the near future for the Fed.  The former Minneapolis Fed president, and former voting FOMC member, is calling for a cut, as a pre-emptive strike to a slowdown.Remember, 2018 was the first since 1994 that cash was the best producing major asset class (among stocks, real estate, bonds, gold).  The culprit was an overly aggressive Fed tightening cycle in a low inflation recovering economy.  The Fed ended up cutting rates in 1995 and spurring a huge run up in stocks (up 36%).

Join me here to get my curated portfolio of 20 stocks that I think can do multiples of what broader stocks do, coming out of this market correction environment.

March 12, 5:00 pm EST

Remember, when oil prices began the fourth-quarter plunge from $76 down to as low as $42, we talked about the damage it would do to the inflation outlook, and how it may provoke a response from the Fed, which it has.

With today’s inflation data, you can see the impact of (yet another) oil price crash.  Headline inflation in the U.S. was running near 3% late last summer, the highest level since 2012. Now it’s 1.5%.


The Fed likes to talk about their assessment of inflation, excluding the effects of volatile oil prices. But they have a record of acting on monetary policy when oil is moving, especially in this post-crisis environment where deflation has been a persistent threat throughout.  They acted in 2016.  And they’ve acted in 2019.

Why?  They have the tools to deal with inflation.  They raise rates.  But the tools are limited to deal with deflation.  They cut rates.  But when rates hit zero, they have to get creative (like QE, negative rates, etc.).  And the consequences of losing the deflation battle are big.  When people hold onto their money thinking things will be cheaper tomorrow than they are today, that mindset can bring the economy to a dead halt. It’s a formula that can become irreversible.

So, we can see why the Fed has been pro-active in response to falling oil prices, falling stocks and falling inflation.  It can all lead to falling confidence.  And that can put them in the position of fighting the dangerous spiral of deflation.

That said, oil is on the rebound.  And as we discussed last month (here), with the quieting of controversy surrounding the Saudi government, it looks like a V-shaped recovery could be in store for oil prices (as we’ve seen with stocks).

Join me here to get my curated portfolio of 20 stocks that I think can do multiples of what broader stocks do, coming out of this market correction environment.