June 22, 2017, 4:15 pm EST Invest Alongside Billionaires For $297/Qtr
Healthcare was the story of the day today. With the Senate having had its go at the house healthcare bill, it goes back to the house, then back through Senate before it gets to the President’s desk.
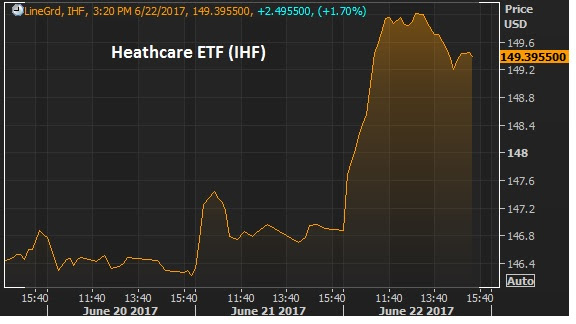
Still, policy progression is very positive in this environment. Healthcare stocks were up big today — the IHF healthcare ETF was up over 2%. This is the ETF that tracks insurers, diagnotic and specialized treatment companies.

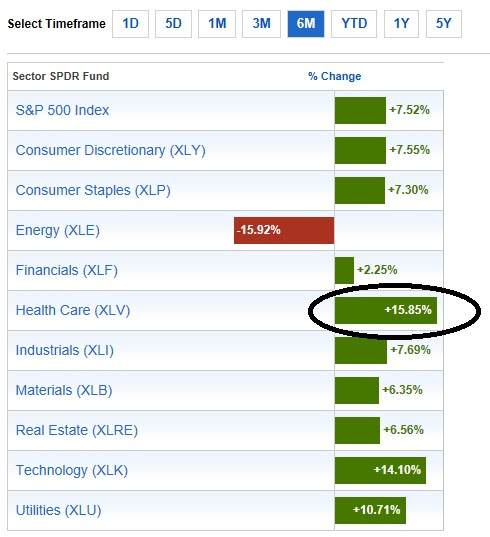
And despite all of the debate around healthcare, it has been the hottest sector to invest in since the election.Since election day, the IHF is up 35% since the lows of November 9th, the day after the election. Here’s a look at S&P sector performance over the past
sixmonths.

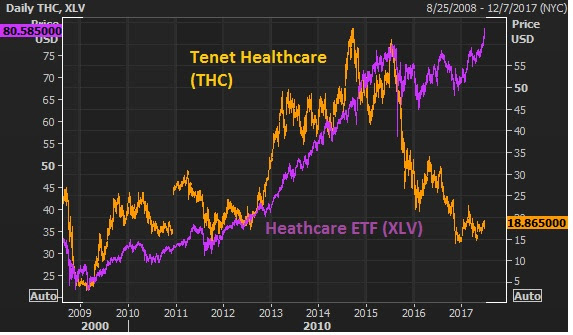
Most interesting, the healthcare sector has been beaten up badly since the cracks in Obamacare became clear back in 2014. But as of the past week, the healthcare sector trackers have finally broken back above those 2014 Obamacare–optimism–driven highs. With that, the divergence in this next chart of one of the biggest hospital companies in the country becomes quite an intriguing trade.

Join the Billionaire’s Portfolio to hear more of my big picture analysis and get my hand-selected, diverse stock portfolio following the lead of the best activist investors in the world.

August 22, 2016, 4:30pm EST
As we head into the end of August, people continue to parse every word and move the Fed makes. Yellen gives a speech later this week at Jackson Hole (at an economic conference hosted by the Kansas City Fed), where her predecessor Bernanke once lit a fire under asset prices by telegraphing another round of QE.
Still, a quarter point hike (or not) from a level that remains near zero, shouldn’t be top on everyone’s mind. Keep in mind a huge chunk of the developed world’s sovereign bond market is in negative yield territory. And just two weeks ago Bernanke himself, intimated, not only should the Fed not raise rates soon, but could do everyone a favor — including the economy — by dialing down market expectations of such.
But the point we’ve been focused on is U.S. market and economic performance. Is the landscape favorable or unfavorable?
The narrative in the media (and for much of Wall Street) would have you think unfavorable. And given that largely pessimistic view of what lies ahead, expectations are low. When expectations are low (or skewed either direction) you get the opportunity to surprise. And positive surprises, with respect to the economy, can be a self-reinforcing events.
The reality is, we have a fundamental backdrop that provides fertile ground for good economic activity.
For perspective, let’s take a look at a few charts.
We have unemployment under 5%. Relative to history, it’s clearly in territory to fuel solid growth, but still far from a tight labor market.

What about the “real” unemployment rate all of the bears often refer to. When you add in “marginally attached” or discouraged job seekers and those working part-time for economic reasons (working part time but would like full time jobs) the rate is higher. But as you can see in the chart below that rate (the blue line) is returning to pre-crisis levels.

In the next chart, as we know, mortgage rates are at record lows – a 30 year fixed mortgage for about 3.5%.

Car loans are near record lows. This Fed chart shows near record lows. Take a look at your local credit union or car dealer and you’ll find used car loans going for 2%-3% and new car loans going for 0%-1%.

What about gas? In the chart below, you can see that gas is cheap relative to the past fifteen years, and after adjusted for inflation it’s near the cheapest levels ever.

Add to that, household balance sheets are in the best shape in a very long time. This chart goes back more than three decades and shows household debt service payments as a percent of disposable personal income.

As we’ve discussed before, the central banks have have pinned down interest rates that have warded off a deflationary spiral — and they’ve created the framework of incentives to hire, spend and invest. You can see a lot of that work reflected in the charts above.
In our Billionaire’s Portfolio, we’re positioned in deep value stocks that have the potential to do multiples of the broader market—all stocks that are owned and influenced by the world’s smartest and most powerful billionaire investors. Join us today and get yourself in line with our portfolio. You can join here.
June 7, 2016, 5:00pm EST
 Yesterday we talked about the bullish technical breakout shaping up in stocks. Today we want to talk about a very quiet bull market going on that supports the story for stocks. It’s commodities.
Within the course of the past four short months, commodities have gone being the leading threat for global stocks, to being a leading indicator of an emerging bull cycle for stocks.
Oil, of course, was the key culprit earlier in the year. At $26 oil the world was a scary place. The dominoes were lining up for widespread bankruptcies, starting in the energy complex and spreading to financials, sovereigns, etc.
If you recall, back in early February we said in our daily notes, “OPEC is not just in a price war with U.S. shale producers, but it’s playing a game of chicken with the global economy. We’ve had plenty of events over the past seven years that have shaken confidence and have given markets a shakeup – European sovereign debt, Greece potentially leaving the euro, among them. In Europe, we clearly saw the solution. It was intervention. Oil prices are creating every bit as big a threat as Europe was, we expect intervention to be the solution this time as well.”
Indeed, central banks stepped in and removed the risk with a slew of intervention tactics ranging from more QE from Europe, currency intervention from Japan, relaxing reserve requirements in China, to the Fed removing the prospects of two (of what was projected to be four) rate hikes this year.
That was the dead bottom in oil (which started with BOJ action in USDJPY). And it kicked broader commodities into gear, many of which had already bottomed weeks prior. No surprise, commodity stocks have been among the best performing stocks in the world for the past four months.
Now we have oil closing above $50 today, for the first time since July of last year. And remember, two of the best oil traders of all time have been calling for oil to trade between $80 and $100 by next year (both Pierre Andurand and Andy Hall).
We looked at this chart in our April 12th piece and said: “technically, oil looks like a technical breakout is here. In the above chart, you can see oil breaking above the high of March 22 (which was $41.90). In fact, we get a close above that level — technically bullish. And we also now have a technically bullish pattern (an impulsive C–wave of an Elliott Wave structure) that projects a move to $51.50, which happens to be right about where this big trendline comes in.”

Source: Reuters, Billionaire’s Portfolio
Here’s that same chart today…

Source: Reuters, Billionaire’s Portfolio
You can see we’ve not only hit this trendline and gotten very close to that projection from April, but (not as easy to see in this chart) we have a clear break of this downtrend now. That line now comes in at $49.39. Oil last traded $50.49.
Next is a look at broader commodities. But first, we want to revisit the clues we were getting from commodities back in early March. Here’s what we said in our March 3rd note: “There are other very compelling signs that the global economy is not only backing away from the edge but maybe turning the corner.
It’s all being led by metals prices. Copper is often an early indicator of economic cycles. People love to say copper has ‘has a Ph.D. in economics’ because it tends to top early at economic peaks and bottom early at economic troughs. Copper bottomed on January 15 and is up 13% since.
The value of iron ore, another key industrial metal, has been destroyed in the past five years – down 80%. That metal bottomed quietly in December and is up 32% since.”
Here’s the chart of broader commodities now…

Source: Reuters, Billionaire’s Portfolio
The Goldman Sachs commodity index is now up 44% from the bottom, though it’s heavily weighted energy. The more diversified CRB index is up 24%. Both would fall into the bull market category for those that like to define bull and bear markets. But bottom line, when you look at the above chart you can see how deeply depressed commodities have been. The trend is broken, and the model signals for big trend followers are flashing all over the place to be long. And as we said yesterday, in early stages of cyclical bull trends in stocks, energy does the best by far. With that, although the energy sector weathered a life threatening storm, the upside remains very big for the survivors.
This Stock Could Triple This Month
In our Billionaire’s Portfolio we followed the number one performing hedge fund on the planet into a stock that has the potential to triple by the end of the month.
This fund returned an incredible 52% last year, while the S&P 500 was flat. And since 1999, they’ve done 40% a year. And they’ve done it without one losing year. For perspective, that takes every $100,000 to $30 million.
We want you on board. To find out the name of this hedge fund, the stock we followed them into, and the catalyst that could cause the stock to triple by the end of the month, click here and join us in our Billionaire’s Portfolio.
We make investing easy. We follow the guys with the power and the influence to control their own destiny – and a record of unmatchable success. And you come along for the ride.
1/29/16
The Bank of Japan stepped in overnight and put a floor under stocks. Only 6 of 42 economists at Bloomberg thought they might do something.
We made the case over the past couple of days that they needed to. The opportunity was ripe, and we thought they would take advantage. They did.
Of course, that’s all the media is talking about today. The word “surprise” is in the headline of just about every major financial news publication on the planet with respect to this BOJ move (WSJ, Reuters, BBC, NYTimes … you name it).
Remember, we said earlier this week, the Fed was just a sideshow and the main event was in Japan. If you understand the big picture: 1) that central banks are still in control, 2) that the baton has been passed from the Fed to the BOJ and the ECB, and 3) that they (central banks) need stocks higher, then this move comes as no surprise.
To follow the stock picks of the world’s best billionaire investors, subscribe at Forbes Billionaire’s Portfolio.
Today we want talk a bit about what these central banks have done, what they are doing and why it works. We often hear the media, analysts, politicians, Fed-haters saying that QE hasn’t worked.
Okay, so QE hasn’t directly produced inflation and solved the world’s problems as the Fed might have expected when they launched it in late 2008. But it has produced a very important direct benefit and indirect benefit. The direct benefit: The Fed has been successful at driving mortgage rates lower, which has ultimately translated to rising house prices (along with a slew of other government subsidized programs). That has been good for the economy.
The indirect benefit: As Bernanke (the former Fed Chair) said explicitly, “QE tends to make stocks go up.” Stocks have gone up – a lot. That has been good for the economy.
But we need a lot more – they need a lot more. Here’s a little background on why…
The Fed has told us all along they want employment dramatically better, and inflation higher. They’ve gotten better employment. They haven’t gotten much inflation. Why? In normal economic downturns, making money easier to borrow tends to increase spending, which tends to increase demand and inflation. In a world that was nearly destroyed by overindebtedness, people (businesses, governments) are focused on reducing debt, not taking on more debt (regardless of how “easy” and cheap you make the money to access).
With that, their best hope to achieve those two targets (employment and inflation) has been through higher stocks and higher housing prices. Strength in these key assets has a way of improving confidence and improving paper wealth. Increasing wealth makes people more comfortable to spend. Better spending leads to hiring. A better job market can lead to inflationary pressures. That’s been the game plan for the Fed. And that’s the gameplan for Europe and Japan.
To follow the stock picks of the world’s best billionaire investors, subscribe at Forbes Billionaire’s Portfolio.
So how do they promote higher stock prices? They do it by promising investors that they will not let another shock event destabilize the world and global financial markets. They’ve promised that they will “stand ready to act” (the exact words uttered by the Fed, the ECB and the BOJ). So, they spent the better part of the past eight years promising to do “whatever it takes” (again exact words of the ECB and BOJ).
The biggest fear investors have is another “Lehman-like event” that can crash stocks, the job market and the economy. The thought of it makes people want to hold on tight to their money. But when the central banks promise to do anything and everything to prevent another shock, it creates stability and confidence to invest, to hire, to take some risk again. That’s good for stock prices.
Now, despite what we’ve just said, and despite the aggressive actions central banks have taken in past years (including the BOJ’s actions last night to push interest rates below zero) and their success in manufacturing confidence and recovery, when stocks fall, people are still quick to talk about recession and gloom and doom. On every dip in stocks since the culmination of the global financial crisis in 2007-2008, the comparisons have been made to that period.
First, they’re ignoring what the central banks have been telling us. “We’re here, ready to act.” Second, and again, things are very, very different than they were in 2007-2008. In that period, global credit was completely frozen. Banks were failing, and the entire financial system was on the precipice of failing. And at that point, it was unclear what could be done and what actions would be taken to try to avert disaster. That uncertainty, the thought of losing 100 years of economic and social progress across the globe, can easily send people scurrying for cash, pulling money from everywhere and protecting what they have. And that uncertainty can, understandably, result in stock prices getting cut in half – a stock market crash.
Now, what’s happening today? The financial system is healthy. Credit is flowing. Unemployment is very close to long-term historical norms. The U.S. economy is growing. The global economy is growing. The best predictor of recession historically is the yield curve. It shows virtually no chance of recession on the horizon. So the economic environment is very different. Still, the biggest difference between that period and today is this: We didn’t have any idea what could be done to avert the disaster OR how far central governments and central banks would go (and could go) to fight it. Now we know. It’s all-in, all or nothing. There is no ambiguity. With that, the central banks will not fail and cannot fail. And remember, they are working in coordination. No one wins if the world falls apart.
With all of this in mind, any decline in stocks, driven by fear and misinformation, offers a great buying opportunity, not an opportunity to run.
We’ll talk Monday about the very strong, and rational fundamental case for stocks to go much higher. On that note, today we’re wrapping up one of the worst January’s on record for stocks, which has given us a great opportunity to buy at a nice discount.
Bryan Rich is co-founder of Billionaire’s Portfolio, a subscription-based service that empowers average investors to invest alongside the world’s best billionaire investors. To follow the stock picks of the world’s best billionaire investors, subscribe at Billionaire’s Portfolio.


