April 1, 5:00 pm EST

Last week we talked about the buildup to the Lyft IPO.

Lyft, “lifted” to a valuation of close to $25 billion when shares started trading on Friday.  Today, it’s down as much as 20% from the Friday highs.

The last private investment valued the company at $15.1 billion.  That gave them a paper gain of over 60% on Friday, for just a 9-month holding period. Good for them.

For everyone else, remember, you’re looking at a company that did a little over $2 billion in revenue, while losing almost a billion dollars. Most importantly, over the three years of data that Lyft shared in its S-1 filing, revenue growth has been slowing and losses have been widening.

So, you’re buying a company that hopes to be profitable in seven years, to justify the valuation today.  This is a company that has only existed seven years.  And to think that we can predict what the next seven will look like, in the ever changing technology and political/regulatory environment (much less economic environment), is a stretch.

For some perspective on these valuations, below is what it looks like if we compare the three largest/dominant car rental car companies (Enterprise, Hertz and Avis) to the two largest/dominant ride sharing companies.


With Uber now expected to be valued at around $120 billion when it goes public (possibly this month), the ride sharing industry is valued at about 14 times the car rental industry.

The rental car industry has been priced as if ride-sharing industry has destroyed it.  Ironically, if the ride sharing movement is to succeed in the long-run, and is to fully reach the potential that is being priced into the valuations, then they will need these car rental companies to supply and manage the fleet of vehicles required for Uber and Lyft to scale.

Join me here to get my curated portfolio of 20 stocks that I think can do multiples of what broader stocks do, through the end of the year.

March 27, 5:00 pm EST

We’ve talked this week about the yield curve inversion.

In response, the market is now pricing in a better than 70% chance of a rate cut in June.  And Trump’s new pick to join the Fed, Stephen Moore, has said the Fed should cut by 50 basis points immediately.We’ve talked about the comparisons between 2019 and 1995.  In 1994 the Fed aggressively tightened into a low inflation, recovering economy (as they did in 2018).  By the middle of 1995, they were cutting.  Stocks finished the year up 36%.

Given the contrast of where the Fed has positioned themselves now, compared to just three months ago, they have effectively eased — and we can see it clearly manifested in the interest rate market.  The 10-year U.S. government bond yield has gone from 3.25% to under 2.5% since just November.  I would argue we already have a repeat of 1995.

Here’s a look, in the chart on the left, at what stocks did in 1994-1995, when the Fed transitioned from overtightening (into a low inflation, recovering economy) to easing.  And, on the right, this is how things look now, with similar context. 


Within a few quarters of the ’95 rate cut, U.S. growth was printing above 4% and did so for 18 consecutive quarters.  Stocks tripled over that period.

Join me here to get my curated portfolio of 20 stocks that I think can do multiples of what broader stocks do, through the end of the year.

March 26, 5:00 pm EST

Yesterday we talked about the yield curve inversion.

It was driven by the Fed walking up the fed funds rate (i.e. “normalizing rates”) over the course of the past three years.  As we discussed yesterday, with global central banks pinning down the long-end of the yield curve through QE (now led by the BOJ), there were few things better telegraphed than the U.S. yield curve inversion.

The market is now pricing in a 66% chance of a rate cut by the end of the year.  The market is arguing that the rate hike the Fed made in December, was a mistake.

When have we seen this script before?  1995.  As we discussed coming into the year, 2018 was the first year since 1994 that cash was the best producing major asset class (among stocks, real estate, bonds, gold).  And the culprit was an overly aggressive Fed tightening cycle in a low inflation recovering economy.

The Fed ended up cutting rates in 1995 and spurring a huge run up in stocks (up 36%).  That’s the bet people are making again.  But I suspect we’ve already seen the equivalent of a cut through the Fed’s dovish posturing since early January.  Remember, they went on a media blitz the first several days of January, dialing down expectations that there would be any more tightening.

Join me here to get my curated portfolio of 20 stocks that I think can do multiples of what broader stocks do, through the end of the year.

March 25, 5:00 pm EST

There was a big technical break in the interest rate market on Friday.   And the yield curve inverted.

What does it mean, and should we be concerned?

First, when people talk about the yield curve, they are typically talking about the yield on the 3-month Treasury bill versus the yield on the 10-year government bond.  The latter should pay more, with the idea that money will cost more in the future (compensating for inflation and an “uncertainty about the future” premium).

When the 10-year is paying you less than you could earn holding a short term T-bill, the yield curve is said to be inverted.  And this dynamic has predicted the past seven recessions.  Why?  Because it typically will be driven by a tighter credit environment, namely banks become less enthused about borrowing in the form of short term loans, to lend that money out in longer term loans.  Money dries up. Unemployment goes up. Demand dries up. Economy dips.

With this in mind, today the 3-month treasury bill pays 2.44%. And the 10-year government bond pays 2.41%.  The spread is negative which makes for an inverted yield curve.

Now, while an inverted yield curve has preceded recessions with a good record, we’ve also had inverted yield curves and no recession has followed.

What isn’t talked about much, is why the yield curve is inverting this time.  It sort of spoils the drama to talk about the “why”.  Unlike any other time in history, we have an interest market that has been explicitly manipulated by global central banks for the past decade (via global QE).  And we have one major central bank (the Bank of Japan) remaining as a buyer of unlimited global assets (that includes U.S. 10 years, which pushes the 10-year yield lower).

Remember, the Bank of Japan’s policy of targeting their 10-year government bond yield at zero, means they will be a buyer of unlimited bonds to push JGB yields back toward zero (price goes up, yields go down).  And when the tide of global rates is rising, pulling UP their yields, they will be a buyer of whatever they need to, to push things back down (and they’ve done just that).

What does that mean?  It means, as the Fed has been walking its short-term benchmark rate higher, the “long-end” of the interest rate market (the 10-year yield) has been anchored by central bank buying – buying by all major central banks for the better part of a decade, and now led by the BOJ.  That has kept a lid on the U.S. 10-year government bond yield, and global government bond yields in general.

With this at work, there have been few things better telegraphed than a U.S. yield curve inversion, as the Fed has told us for years that they will march their short-term rate beyond the anchored 10-year yield.
It’s often dangerous to say “this time is different”, but I think it’s fair to say that the past yield curve inversion/recession analyses don’t compare, when you have both components (the front-end and the long-end) completely controlled by global central banks for more than a decade.  Join me here to get my curated portfolio of 20 stocks that I think can do multiples of what broader stocks do, through the end of the year.

March 19, 5:00 pm EST

We’ve seen the verbal and Twitter shots taken by Trump at the tech giants since he’s been in office.  And the threats have slowly been materializing as policy.

We get this today …


With this in mind, we’ve talked quite a bit about the domestic leveling of the playing field. The tech giants (Facebook, Amazon, Netflix, Google, Twitter …) are on the regulatory path to being held to a similar standard that their “old economy” competitors are held to.  They may have to pay for real estate (i.e. bandwidth). They may be scrutinized more heavily for anti-competitive practices.  And they may be liable for content on their site, regardless of who created it.

The latter was the subject of the Trump tweet today.  And he was asked about it in a press conference.  He said we “have to do something about it.”  He called the discrimination and bias “collusion” from the tech giants.

The regulation is coming. And depending on the degree, at best, it changes the business models of these “disrupters.” At worse, it could destroy them.  Imagine, Facebook and Twitter being held liable for things their customers are saying on their platforms.  That’s endless compliance to ward of business killing liabilities.

As compliance costs go UP for these companies.  The cost goes UP for consumers. The model is changed.

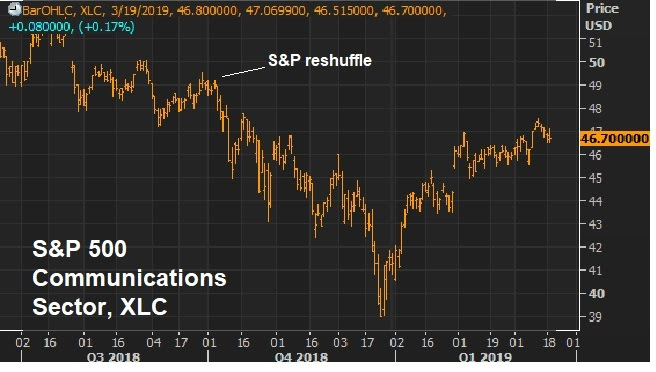
On a related note, remember, last September the S&P 500 reshuffled the big tech giants.  Among the changes, they moved Facebook, Google and Twitter out of the tech sector and in to the telecom sector (re-named the “Communications” sector”).

Here’s what that sector ETF looks like since …

Join me here to get my curated portfolio of 20 stocks that I think can do multiples of what broader stocks do, coming out of this market correction environment.

March 18, 5:00 pm EST

Stocks open the week in breakout mode.

We’ve now taken out the December highs, the levels that preceded the sharp 20% plunge.

So, now we have this chart as we enter a week with a Fed meeting on the agenda.


This leaves us up 13% on the year, and with another 4% climb to regain the October all-time highs.

The Fed meets this week.  With a relatively light data and news week, the Fed will get plenty of attention.  But remember, we know exactly where they stand.  They want to maintain confidence in the economy.  And they know the stock market is an important contributor (and can be a dangerous detractor) to confidence.  They need stocks higher.

That’s why on January 4th, the Fed responded to the plunging stock market by marching out the current and past two leaders of the Fed to tell us the “normalization phase” on interest rates was over (i.e. no more rate hikes).

And that’s why on March 10th (just a week ago), in response to a 4% one-day plunge in Chinese stocks and some loss of momentum in the U.S. stock market rebound, Powell followed the script of his predecessor Ben Bernanke, and spoke directly to the public through an exclusive 60 Minutes interview, to reassure the public that the economy was in good shape, and that the Fed was there to ensure stability.  If you bought stocks after both interviews, you felt no pain and have been rewarded handsomely.

With the above chart in mind, below is the chart we looked at to start the year, as we discussed the potential for a V-shaped recovery following the Fed’s January 4th strategic pivot.

From my January 4th Pro Perspectives note:
“We entered the year with the idea that the Fed would need to walk back on its rate hiking path this year (possibly even cutting, if the stock market environment persisted).  And today, just days into the new year, we get the Fed Chair Powell, former Fed Chairs Yellen and Bernanke telling us that the Fed is essentially done of the year, unless things improve … [as for stocks] We broke a big level today on the way up in the S&P 500 (2520) and it looks like a V-shaped recovery is underway, to take us back to where stocks broke down on December 3rd.  That would be 12% from current levels.” So, far so good. The Fed has stabilized confidence.  The question now is, do we get a deal with China soon?  If not, we may find a rate cut, in the near future for the Fed.  The former Minneapolis Fed president, and former voting FOMC member, is calling for a cut, as a pre-emptive strike to a slowdown.Remember, 2018 was the first since 1994 that cash was the best producing major asset class (among stocks, real estate, bonds, gold).  The culprit was an overly aggressive Fed tightening cycle in a low inflation recovering economy.  The Fed ended up cutting rates in 1995 and spurring a huge run up in stocks (up 36%).

Join me here to get my curated portfolio of 20 stocks that I think can do multiples of what broader stocks do, coming out of this market correction environment.

March 15, 5:00 pm EST

As we end the week, let’s take a look at what China is doing to stimulate the economy.

If the world has been worried about global growth, because of the toll that trade reform is taking on China, then the actions China has been taking, and has discussed overnight, should be THE focus for markets — in addition to the status of a U.S./China trade deal.

Remember, by the end of last year, much of the economic data in China was running at or worse than 2009 levels (the depths of the global economic crisis).  It’s clear that the era of double-digit growth in China is over (at the expense of the rest of the world).  The question is, how low can it go, without threatening an uprising against the regime.  They seem to be willing to do ‘whatever it takes’ to defend the 6% growth number.

With that, as we’ve discussed, for a sustained recovery in global growth, expect others to follow the lead of the U.S. with big fiscal stimulus and structural reform (i.e. Europe, Japan …. and China).  With the news overnight from Chinese Premier Li (who has been the pointman for U.S./China trade negotiations), China is preparing an assault on the growth slowdown.  He’s promising an aggressive mix of monetary and fiscal stimulus.

They are looking to do large-scale tax cuts. They’ve promised billions of dollars infrastructure spending.  They’ve already cut the reserve requirement for banks five times in the past year – and they are looking to do more to motivate bank lending.  And they are targeting to create 13 million jobs this year in the manufacturing sector and in small business.

As we’ve discussed, Chinese stocks are reflecting optimism that a bottom is in for the trade war and for Chinese economic fragility.


Join me here to get my curated portfolio of 20 stocks that I think can do multiples of what broader stocks do, coming out of this market correction environment.

March 14, 5:00 pm EST

Wall Street has a lot of adages that many follow, and few question (but they should).

One of them:  The bond market is smarter than the stock market.

The logic is that bond market investors are better and quicker at interpreting news and information than stock investors.  As such, the belief is that bonds will be pricing in the more probable outcome before stocks.

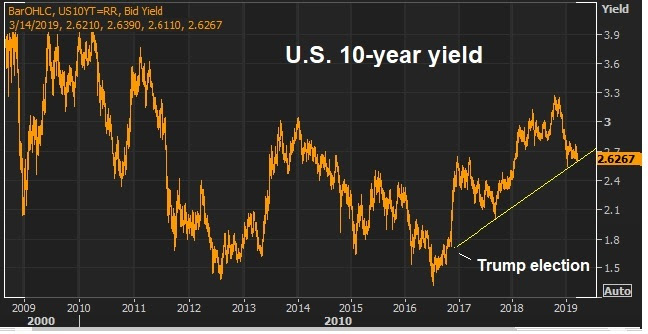
So, is there a signal to be taken from the behavior of the 10-year yield?  While stocks have fully recovered the losses of December, you might expect the bond market to reflect the ease in uncertainty (i.e. moving back higher, along with stocks).  But bond yields are back near the lows of early last year, and appear to be pricing OUT some (and threatening to price out all) of the optimism that followed the Trump election.


With that, at 2.60% on the U.S. 10-year government bond yield (a global benchmark interest rate), is there an element of worst-case scenario for the global economy being priced in?  I’d say with the U.S. economy growing at 3%, and stocks at these levels, even when the 10-year was at 3.25%, bonds were (to some degree) pricing the worst-case scenario.

So, why are bond yields as low as 2.60%?  Smarter market participants?  No.  It’s intervention/manipulation.  Sure, the Fed has put the brakes on its policy direction.  The ECB has reversed course on policy!  China is easing.  But, most importantly, the Bank of Japan is still executing on an unlimited QE campaign.

The Bank of Japan’s yield targeting policy gives it the license to buy unlimited assets.  They have been and will continue to buy U.S. government bonds, and they continue to be the anchor for global interest rates.  And it’s safe to say, they are acting with plenty of coordination with the other major central banks in the world (namely, the Fed).

Bottom line:  The interest rate picture is signaling one very clear action.  The Bank of Japan is still engaging in full throttle QE. 

Join me here to get my curated portfolio of 20 stocks that I think can do multiples of what broader stocks do, coming out of this market correction environment.

March 13, 5:00 pm EST

We haven’t talked much about the Brexit drama.

Why?  Because it has been noisy, yet unlikely to create any shock-waves through the global economy.

Even the knee-jerk reaction to the Brexit vote in 2016, didn’t have staying power.  The uncertainty that was quickly manifested in global stocks, was just as quickly reversed.  You can see it in the S&P chart below …


Why the sharp reversal?  And why isn’t Brexit a big shock risk?

We had seen a similar movie before: Grexit.  Greece’s EU and EMU partners talked tough about a “my way or the highway” bailout plan, which included harsh austerity. But when push came to shove, the Greek’s stood their ground, resisted the harsh austerity measures that came with the bailout, and it quickly became clear that Europe had more to lose, than did Greece, by the Greeks leaving the EU and (most importantly) leaving the euro. The Greek’s had negotiating leverage.  And they got concessions.
In the case of Brexit, the EU partners started with tough talk too, promising a dark and ugly future for the UK.  But the EU had/has plenty of risk (i.e. others following the lead of Britain … ex. Italy, Spain).  Clearly they both need each other to thrive.  The UK loses if the EU implodes.  The EU loses if the UK implodes.

The populist movement that gave us Grexit, gave us Brexit and then the Trump election, and recently a new government in Italy with an “Italy first” agenda.  It’s a movement of reform.  And reform is now becoming the norm, not the extreme. We’re hoping to see reform in China now too.

Join me here to get my curated portfolio of 20 stocks that I think can do multiples of what broader stocks do, coming out of this market correction environment.

March 12, 5:00 pm EST

Remember, when oil prices began the fourth-quarter plunge from $76 down to as low as $42, we talked about the damage it would do to the inflation outlook, and how it may provoke a response from the Fed, which it has.

With today’s inflation data, you can see the impact of (yet another) oil price crash.  Headline inflation in the U.S. was running near 3% late last summer, the highest level since 2012. Now it’s 1.5%.


The Fed likes to talk about their assessment of inflation, excluding the effects of volatile oil prices. But they have a record of acting on monetary policy when oil is moving, especially in this post-crisis environment where deflation has been a persistent threat throughout.  They acted in 2016.  And they’ve acted in 2019.

Why?  They have the tools to deal with inflation.  They raise rates.  But the tools are limited to deal with deflation.  They cut rates.  But when rates hit zero, they have to get creative (like QE, negative rates, etc.).  And the consequences of losing the deflation battle are big.  When people hold onto their money thinking things will be cheaper tomorrow than they are today, that mindset can bring the economy to a dead halt. It’s a formula that can become irreversible.

So, we can see why the Fed has been pro-active in response to falling oil prices, falling stocks and falling inflation.  It can all lead to falling confidence.  And that can put them in the position of fighting the dangerous spiral of deflation.

That said, oil is on the rebound.  And as we discussed last month (here), with the quieting of controversy surrounding the Saudi government, it looks like a V-shaped recovery could be in store for oil prices (as we’ve seen with stocks).

Join me here to get my curated portfolio of 20 stocks that I think can do multiples of what broader stocks do, coming out of this market correction environment.