July 24, 5:00 pm EST

As we’ve discussed, tech and small-caps (the Nasdaq and the Russell 2000) have been big outperformers on the year, compared to blue-chip stocks. But today seemed like an exhaustive move in that divergence.

There was a clear rotation out of the small-caps (which finished down on the day) and into the blue chips (the Dow finished up nicely on the day). And the red-hot Nasdaq reversed from new record highs to finish flat.

Trump tweeted this morning that tariffs are bringing trade parters to the negotiating table. He seems to be confident that his meeting with EU Chief Jean-Claude Juncker tomorrow will result in concessions from Europe. And there seems to be movement on a new NAFTA deal too. Add this to more good earnings hitting from second quarter earnings season, and it’s enough to get big investment managers moving back into the blue-chip multinationals.

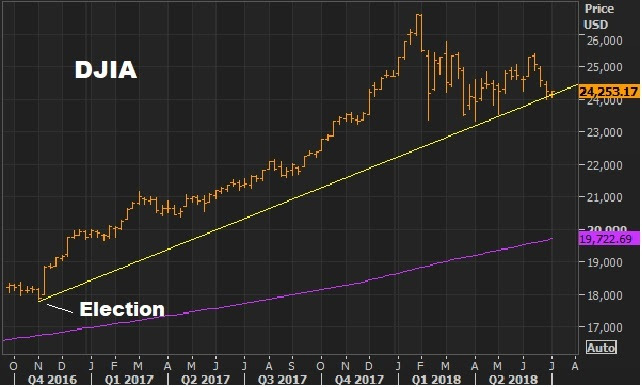
Remember, we’ve been watching this chart. The Dow still has a long way to go, to recover the record highs of earlier this year. But the technical breakout of this corrective downtrend has broken.

If you haven’t joined the Billionaire’s Portfolio, where you can look over my shoulder and follow my hand selected 20-stock portfolio of the best billionaire owned and influenced stocks, you can join me here.


July 9, 5:00 pm EST

We’ve talked about the glaring lag in the performance of blue chip stocks coming out of this recent stock market correction.  This is creating a huge opportunity to buy the Dow, now.

With all of the complexities you can make of investing, this one is simple.  The blue-chip Dow Jones Industrials Index is down on the year (as of this morning).  The Nasdaq is up 13% on the year.  Small caps (the Russell 2000) is up 11%.

And we’re in an economy that’s running at better than 3% growth, with low inflation, ultra-low rates, and corporate earnings growing at 20% year-over-year. With this formula, and yet a tame P/E multiple on stocks, we’ll probably see stocks up double digits before the year is over.  Meanwhile, we are already in July, and the DJIA — the most important benchmark stock index for global markets – is starting from near zero.

You may be thinking the boring “industrials” average is out-dated, and flat for a reason. But as far as the makeup of the indices is concerned:  The index curators will shuffle the constituents to ensure that the biggest, best performing companies are in it.  Bad stocks get kicked out.  Good stocks get added.  And, to be sure, your retirement money will be methodically plowed into it (the benchmark indices) every month by Wall Street investment professionals.

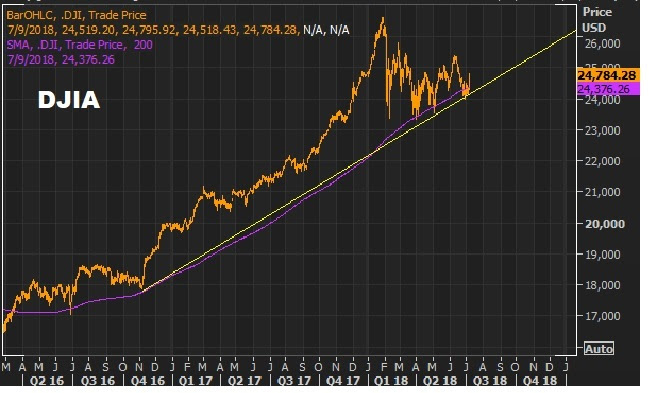
Bottom line:  The DJIA is presenting a gift here to invest, at a discount, in an economy that’s heating up.  And you get this chart, which we’ve been watching in recent weeks.  This big trend line has held, and so has the 200-day moving average.

How do you buy it?  Your financial advisor will put you into mutual funds with big sales loads and fees in attempt to track the Dow.  But you can buy an ETF that tracks the Dow for as little as 17 basis points (example: symbol DIA, the SPDR DJIA ETF).  This Dow looks like low hanging fruit.
If you haven’t joined the Billionaire’s Portfolio, where you can look over my shoulder and follow my hand selected 20-stock portfolio of the best billionaire owned and influenced stocks, you can join me here.
July 2, 5:00 pm EST

As we head in to the holiday week, markets will likely go quiet until we get Friday’s jobs number.

We’re now into the second half of the year.  After stocks got out to a huge start in January (up 7% in just the first 18 trading days of the year), we’ve since had a textbook correction of about 12%.  And we currently sit up only 1% in the S&P 500 for the year.  And the Dow is still down, -1.8%.

But we have this chart on the Dow that looks very intriguing…

The DJIA is trading perfectly into the trendline that represents this post Trump-election rally.

Given that technical backdrop, the underperformance of the Dow relative to small caps and tech stocks, and a 16 P/E, the blue-chip American companies are a bargain in a world of sub-3% ten-year yields.

This sets up a second half, where money aggressively moves back toward the blue chips.

Remember, as we worked through the price correction in stocks for the first half, we were awaiting Q1 earnings to show the early signs of fiscal stimulus working on the economy.  We got it.  We had big positive surprises on an earnings season that was already projected to do nearly 20% earnings growth.

Now, as we enter the second half, we should start to see the positive surprises in the economic data.

If you haven’t joined the Billionaire’s Portfolio, where you can look over my shoulder and follow my hand selected 20-stock portfolio of the best billionaire owned and influenced stocks, you can join me here.