|
|
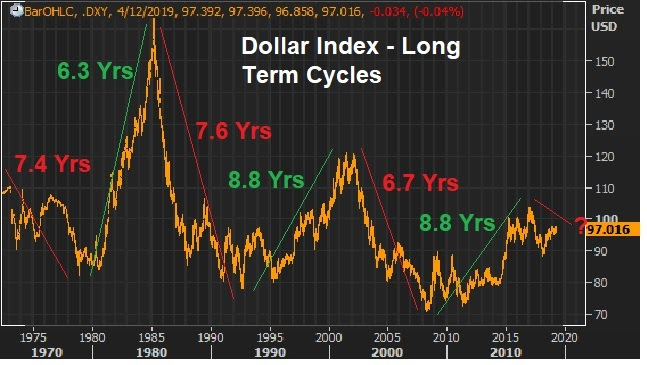
April 9, 5:00 pm EST A key piece in the continuation of the global economic recovery will be a weaker dollar. It will drive a more balanced U.S. and global economy, and it will reflect strength in emerging markets (i.e. capital flows to emerging markets). To this point, as we’ve discussed, higher U.S. rates have meant a stronger dollar. With global central banks moving in opposite directions in recent years, capital has flowed to the United States. But the emerging markets have suffered under this dynamic. As money has moved OUT of emerging market economies, their economies have weakened, their currencies have weakened, and their foreign currency denominated debt has increased. But now we have a retrenchment from the Fed. And we have coordinated global monetary policy (facing in the same direction). This sets up to solidify a long-term bear market for the dollar. Let’s take a look at a couple of charts that argue the long-term trend is already lower, and the next leg will be much lower. First, here’s a revisit of the long-term dollar cycles, which we’ve looked at quite a bit in this daily note. Since the failure of the Bretton-Woods system, the dollar has traded in six distinct cycles – spanning 7.6 years on average. Based on the performance and duration of past cycles, the bull cycle is over, and the bear cycle is more than two years in. |
 |
|
With this in mind, if we look within this current bear cycle, technically the dollar is trading into a major resistance area – a 61.8% retracement. The next leg should be lower, and for a long period of time. |
 |
|
Trump wants a weaker dollar, and I suspect he’s going to get it.
Sign up to my Billionaire’s Portfolio and get my market beating Billionaires Portfolio … Live Portfolio Review conference calls … Weekly notes with updates and specific recommendations on following the best billionaire investors … Access to my member’s only area on the Billionaire’s Portfolio. Plus, my blog — full of information that will set you apart from other average investors. Join now and get your risk free access by signing up here. |
|
August 14, 5:00 pm EST We talked yesterday about the sharp currency devaluation in Turkey over the past few days. The Lira bounced aggressively today, which soothes some fears in global markets. As I said, many have made comparisons to the Asian currency crisis of the late 90s, and have speculated on the potential for the events in Turkey to ultimately destabilize global markets. But as we discussed yesterday, this looks more like the 2014 currency attack on the Russian ruble — a geopolitically-driven crippling of an economy with bad behaving leadership. With that in mind, here’s what happened to U.S. stocks back in 2014, when the ruble lost 5% of its value (vs the dollar) in just 7 days. But the decline was fully recovered in just 3 days. |
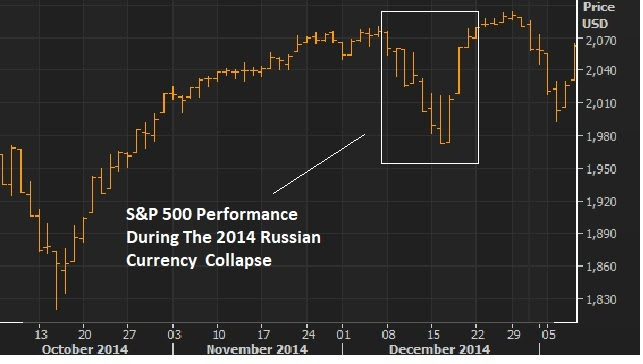 |
|
U.S. stocks have been the proxy for global market stability throughout the past decade (the crisis and post-crisis era). So, for perspective on just how shaky the Turkey influence is being perceived, the S&P 500 sits just one percent off of all-time highs at today’s close. Remember, the ECB stands ready to plug any holes necessary in European bank exposure to Turkish debt. That euro-denominated debt has been the risk people immediately homed in on. The real question is, will this (currency crisis) ultimately end in China, with a revaluation of the yuan, or perhaps a free-floating yuan? |

If you haven’t joined the Billionaire’s Portfolio, where you can look over my shoulder and follow my hand selected 20-stock portfolio of the best billionaire owned and influenced stocks, you can join me here. |
July 20, 5:00 pm EST
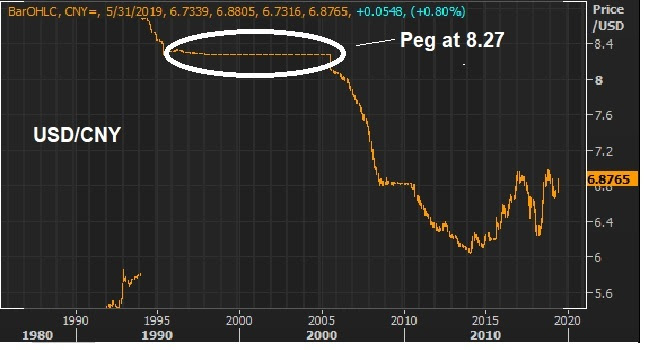
We’ve been watching the Chinese currency very closely, as the Chinese central bank has been steadily marking down the value of its currency by the day, in efforts to offset U.S. trade tariffs.
Remember, in China, they control the value of their currency. And they’ve now devalued by 8% against the dollar since March. They moved it last night by the biggest amount in two years. That reduces the burden of the 25% tariff on $34 billion of Chinese goods that went into effect earlier this month.
But Trump is now officially on currency watch. Yesterday in a CNBC interview he said the Chinese currency is “dropping like a rock.” And he took the opportunity to talk down the dollar.
The Treasury Secretary is typically from whom you hear commentary about the dollar. And historically, the Treasury’s position has been “a strong dollar” is in the countries best interest. But Trump clearly doesn’t play by the Washington rule book. So he promoted his view on the dollar (at least his view for the moment)–and it may indeed swing market sentiment.
The dollar was broadly lower today. We’ll see if that continues. If so, it may neutralize the moves of China in the near term. Nonetheless, the U.S./China spat is reaching a fever pitch. Someone will have to blink soon. Trump has already threatened to tax all Chinese imports. The biggest risk from China would be a big surprise one-off devaluation. As we discussed yesterday, that would stir up a response from other big trading partners (i.e. Europe and Japan). And they may coordinate, in that scenario, a threat to block trade from China all together.
If you haven’t joined the Billionaire’s Portfolio, where you can look over my shoulder and follow my hand selected 20-stock portfolio of the best billionaire owned and influenced stocks, you can join me here.
May 16, 5:00 pm EST
We’ve talked about the stock market’s discomfort with the 3% mark in rates. People have been concerned about whether the U.S. economy can withstand higher rates–the impact on credit demand and servicing. That fear seems to be subsiding.
But often the risk to global market stability is found where few are looking. That risk, now, seems to be bubbling up in emerging market currencies. We have a major divergence in global monetary policies (i.e. the Fed has been normalizing interest rates while the rest of the world remains anchored in emergency level interest rates). That widening gap in rates, creates capital flight out of low rate environments and in to the U.S.
That puts upward pressure on the dollar and downward pressure on these foreign currencies. And the worst hit in these cases tend to be emerging markets, where foreign direct investment in these countries isn’t very loyal (i.e. it comes in without much commitment and leaves without much deliberation).
You can see in this chart of the Brazilian real, it has been ugly …

Something to watch, as a lynchpin in this EM currency drama, is the Hong Kong dollar. Hong Kong has maintained a trading band on its currency since 2005 that is now sitting on the top of the band, requiring a fight by the central bank to maintain it. If they find that spending their currency reserves on defending their trading band is a losing proposition, and they let the currency float, then we could have another shock event for global markets, as these EM currencies adjust and their foreign-currency-denominated debt becomes a default risk. This all may force the rest of the global economy to start following the Fed’s lead on interest rates earlier then they would like to (to begin closing that rate gap, and avoid a shock event).
May 26, 2017, 2:30pm EST Invest Alongside Billionaires For $297/Qtr
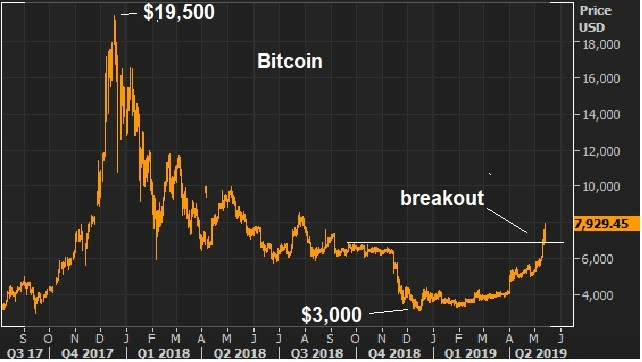
The past few days we’ve looked at the run up in bitcoin. Remember, I said: “If you own it, be careful. The last time the price of bitcoin ran wild, was 2013. It took about 11 days to triple, and about 18 days to give it all back. This time around, it’s taken two months to triple (as of today). ”
It looks to be fueled by speculation, and likely Chinese money finding its way out of China (beating capital controls). And yesterday we talked about the potential disruption to global markets that could come with a crash in bitcoin prices.
I suspect that’s why gold is finally beginning to move today, up almost 1%, and among the biggest movers of the day as we head into the long holiday weekend (an indication of some money moving to gold to hedge some shock risk).
Remember yesterday we looked at the chart on Chinese stocks back in 2015 and compared it to bitcoin. The speculative stock market frenzy back thin was pricked when the PBOC devalued the yuan later in the summer.
Probably no coincidence that bitcoin’s recent acceleration happened as Moody’s downgraded China’s credit rating this week for the first time since 1989 (an event to take note of). Yesterday, the PBOC was thought to be in buying Chinese stocks (another event to take note of). And this morning, the PBOC stepped in with another currency move! Historically, major turning points in markets tend to come with some form of intervention. Will a currency move be the catalyst to end the bitcoin run, as it did the runup in Chinese stocks two years ago?
Let’s take a look at what the currency move overnight means …
Keep in mind, the currency is China’s go-to tool for fixing problems. And they have problems. The economy is crawling around recession like territory. The debt was just downgraded. And they’ve had a tough time managing capital flight. As an easy indicator: Global stocks are soaring. Chinese stocks are dead (flat on the year).

Remember, their rapid economic ascent in the world came through exports (via a weak currency). The move overnight is a move back toward tying its currency more closely to the dollar. Which, if this next chart plays out, will also weaken the yuan compared to other big exporting competitors in the world.
That should help the Chinese economic outlook, which may help stem the capital flight (which has likely been a significant contributor to bitcoin’s rise).
May 25, 2017, 4:00pm EST Invest Alongside Billionaires For $297/Qtr
We talked yesterday about run up in bitcoin. The price of bitcoin jumped another 14% today before falling back.
As I said yesterday, it looks like Chinese money is finding it’s way out of China (despite the capital controls) and finding a home in bitcoin (among other global assets). If you own it, be careful. The last time the price of bitcoin ran wild, was 2013. It took about 11 days to triple, and about 18 days to give it all back. This time around, it’s taken two months to triple (as of today).
If you’re looking for a warning signal on why it might not be sustainable (this bitcoin move), just look at the behavior across global markets. It’s not exactly an environment that would inspire confidence.
Gold is flat. Interest rates are soft. Stocks are constantly climbing. Commodities are quiet, except for oil — which fell back below $50 today on news that OPEC did indeed agree to extend its production cuts out to March of next year (bullish, though oil went south).
When the story is confusing, conviction levels go down, and cash levels go up (i.e. people de-risk). And maybe for good reason.
In looking at the bitcoin chart today, I thought back to the run up in Chinese stocks in early 2015. Here’s a look at the two charts side by side, possibly influenced by a lot of the same money.
The crash in Chinese stocks took global markets with it. It’s often hard to predict that catalyst that might prick a bubble and even harder to see the links that might lead to broader market instability. In this case, though, there are plenty of signs across markets that things are a little weird.
Invitation to my daily readers: Join my premium service members atBillionaire’s Portfolio to hear more of my big picture analysis and get my hand-selected, diverse stock portfolio where I follow the lead of the best activist investors in the world. Our goal is to do multiples of what broader stocks do. Our portfolio was up 27% in 2016. Join me today, risk-free. If for any reason you find it doesn’t suit you, just email me within 30-days.
March 16, 2017, 3:30pm EST Invest Alongside Billionaires For $297/Qtr
Following the Fed yesterday, we heard from the Bank of Japan overnight, and the Bank of England this morning. As for Europe, we heard from the ECB last week.
Coming into this week we’ve had this ongoing dynamic, for quite some time, of the Fed going one way on rates (up) and everyone else going the other way (cutting rates, QE, etc.).
That’s been good for the dollar, as global capital tends to flow toward areas with rising interest rates and better growth prospects. That combination tends to mean a rising currency and rising investment values. What really determines those flows though, is the perception of how that policy spread, between countries, may change. Most recently, that perceived change in the spread has been in favor of it growing, i.e. Fed policy tighter or at least stable, while other spots of the world considering even easier on monetary policy.
That divergence in policy has been bad for currencies like the euro, the pound and the yen. But that hit to the currency is part of the recipe. It promotes higher asset prices, better exports and growth. And as Bernanke says, QE tends to make stocks go up, which helps.
Still, those stocks have lagged the strength in U.S. stocks. With that, over the past six months or so, I’ve talked about the opportunities in European and Japanese stocks for a catch up trade.
While U.S. stocks have continued to set new record highs, stocks in Europe and Japan have yet to regain the highs of 2015 — when the global economy was knocked off course, first by slowing China and a surprise currency devaluation, and later by a crash in oil prices.
With that, if you think Trumponomics marked the end of the decade long deleveraging period (post-financial crisis), and that the Fed is signaling that by ending emergency level monetary policy, then the rest of the world should follow. That means the next move in Europe, Japan, the UK will be toward normalization, not toward more emergency policies.
That means the expectations on the policy gap narrows. With that, we may have seen the bottom in the euro. If negative interest rates and an election cycle that has parties that are outright promising to destroy the euro can’t push it to parity, what can? If it can’t go lower, it will go higher.

And if the euro has bottomed and the next move for the central bank in Europe is tapering, the first step toward ending emergency policies, then this stock market in Europe looks the most intriguing for a big catch up trade – still about 20% off of the 2015 highs and well below the pre-crisis all time highs.

In our Billionaire’s Portfolio, we’re positioned in a portfolio of deep value stocks that all have the potential to do multiples of what broader stocks do — all stocks owned and influenced by the world’s smartest and most powerful billionaire investors. Join us today and we’ll send you our recently recorded portfolio review that steps through every stock in our portfolio, and the opportunities in each.
February 10, 2017, 4:00pm EST Invest Alongside Billionaires For $297/Qtr

I suspect that Trump will come away, after a weekend in Palm Beach with Abe, learning that Abenomics is good for the U.S., and good global growth and stability (in the current global economic environment).
And one of the keys to success in Abenomics is a weaker yen, which translates to a stronger dollar. As I’ve said, the weak yen has been pulled into the fray with Trump’s tough talk on trade imbalances, but his beef on currency advantage is really directed toward China – not Japan, not Mexico, not even Europe.
With that, and with the assumption that the yen may be pardoned for a while, the dollar bouncing against the yen as we head into the weekend. And it looks like we may see a technical breakout and an even higher dollar, lower yen in our future.

And Japanese stocks look set to break out too, to catch up to the strength of U.S. stocks. The Nikkei is 8% off of the 2015 highs, while U.S. stocks are on record highs, and 8% ABOVE its 2015 highs.

Another catch up trade: German stocks. Despite the growing attention given to the French nationalist candidate, Le Pen, who has been anti-euro and anti-European Union, right or wrong the bond market isn’t showing any new interest in disaster insurance in Europe, nor is the euro.

With that, German stocks look very good, still about 8% from the 2015 highs, and the technical correction clearly ended last summer.
Lastly, let’s take a look at another big sleeper stock market, China…

You can see how Copper is on a big run (up 10% ytd). That typically correlates well with expectations of global growth. Global growth is typically good for China. Of course, China is in the crosshairs of Trump’s fair trade movement, but if you think there’s a chance that more fair trade terms can be a win for the U.S. and a win for China, then Chinese stocks are a bargain here.
Have a great weekend!
For help building a high potential portfolio for 2017, follow me in our Billionaire’s Portfolio, where you look over my shoulder as I follow the world’s best investors into their best stocks. Our portfolio more than doubled the return of the S&P 500 in 2016. You can join me here and get positioned for a big 2017.
February 7, 2017, 4:00pm EST Invest Alongside Billionaires For $297/Qtr
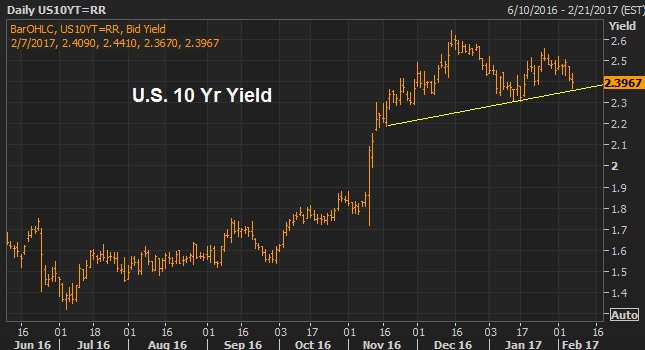
Yesterday we looked at the slide in yields (U.S. market interest rates — the 10-year Treasury yield). That continued today, in a relatively quiet market.
Let’s take a look at what may be driving it.
If you take a look at the chart below, you can see the moves in yields and gold have been tightly correlated since election night: gold down, yields up.
As markets began pricing in a wave of U.S. growth policies, in a world where negative interest rates were beginning to emerge, the benchmark market-interest-rate in the U.S. shot up and global interest rates followed. The German 10-year yield swung from negative territory back into positive territory. Even Japan, the leader of global negative interest rate policy early last year, had a big reversal back into positive territory.
And as growth prospects returned, people dumped gold. And as you can see in the chart above of the “inverted price of gold,” the rising line represents falling gold prices.
Interestingly, gold has been bouncing pretty aggressively since mid December. Why? To an extent, it’s pricing in some uncertainty surrounding Trump policies. And that would also explain the slow down and (somewhat) slide in U.S. yields. In fact, based on that chart above and the gold relationship, it looks like we could see yields back below 2.10%. That would mean a break of the technical support (the yellow line) in this next chart …
Another reason for higher gold, lower yields (i.e. higher bond prices), might be the capital flight in China. Where do you move money if you’re able to get it out in China? The dollar, U.S. Treasuries, U.S. stocks, Gold.
The data overnight showed the lowest levels reached in the countries $3 trillion currency reserve stash in 6 years. That, in large part, comes from the Chinese central banks use of reserves to slow the decline of their currency, the yuan. Of course a weakening yuan only inflames U.S. trade rhetoric.
For help building a high potential portfolio for 2017, follow me in our Billionaire’s Portfolio, where you look over my shoulder as I follow the world’s best investors into their best stocks. Our portfolio more than doubled the return of the S&P 500 in 2016. You can join me here and get positioned for a big 2017.

