November 29, 2017, 4:30 pm EST
The adoration for Bitcoin has been growing by the day, though no one understands how to value it.
CNBC went on “watch” the other day for Bitcoin $10,000. Today it traded above $11,000 and then fell as much as 21% from the highs.
Here’s a look at the chart.
 I heard someone today say, everyone should have a small portion of their net worth in Bitcoin. That sounds an awful lot like the mantra for gold. Gold has been sold all along as an inflation hedge. But unless you have Weimar Republic-like hyperinflation, you’re unlikely to get the inflation-hedge value out owning it.
Remember, gold went on a tear from sub-$700 to above $1,900 following the onset of global QE (led by the Fed). Gold ran up as high as 182%. That was pricing in 41% annualized inflation at one point (as a dollar for dollar hedge). Of course, inflation didn’t comply. Still, nine years after the Fed’s first round of QE and massive global responses, we’ve been able to muster just a little better than 1% annualized inflation. So gold is a speculative trade. It’s a fear trade. And it’s volatile.
If you bought gold at the top in 2011, the value of your “investment” was cut in half just four years later. That’s a lot of risk to take for the prospect of “hedging” against the loss of purchasing power in the paper money in your wallet.
Now, Bitcoin is becoming a pretty polarizing “asset class.” The gold bugs get very emotional if you argue against the value of owning gold. Those that own Bitcoin seem to have a similar reaction. But Bitcoin, like gold, is a tough one to value. You buy it because you hope someone is going to buy it from you at a higher price.
So is Bitcoin (cryptocurrencies) an investment? Sophisticated investors that are involved, likely see it as similar investment to a startup. It has traction. It has a lot of risks. It could go to zero. Or it could pay them multiples of what they pay for it. But they thrive on diversification. When they have a large portfolio of these types of bets, when a few payoff, they put up nice returns. Bitcoin may be one of the few, or it may not.
November 9, 2017, 4:00pm EST
Japanese stocks have been a huge mover over the past quarter, as we discussed earlier this week. That move extended to a new 25-year high overnight. And then we got this …
|
|
As you can see on the far right of this daily chart, the Nikkei had a very slippery reversal to post an 1,110 point range for the day (closing near the lows).
This was the biggest range in the Nikkei since exactly one year ago today. That was the night of the U.S. elections (the day, in Japan).
Now, despite the huge range of the day, today’s losses in Japanese stocks were only 1.7% (open to close). Let’s take a look back over the past two years, though, to other times we’ve had a 1,000+ point range and on a down day.
There was the Brexit surprise in June 2016 (-9%). And then when the Bank of Japan shocked world markets in a scheduled meeting by NOT upping its QE program in April 2016 (-7%). Prior to that, was the middle of January of 2016 when oil prices were crashing (-4% and -4% two out of three trading days). Then there was December 18, 2015, the day after the Fed made its first post-crisis Fed hike (-2%). And then we had a day in August 2015 (-6%) and into the first day of September (-5%). These were driven by a surprise devaluation of the Chinese yuan, which set off a global stock market slide on fears of a weaker China, than most thought.
Now, we’ve just looked at all of the days for Japanese stocks where the range has been greater than 1,000 points and stocks have finished down. As you might deduce, these days all share a common thread. There was a big event related to these moves. So what was the event that caused this last night?
Nothing, of note. That’s concerning. Is there something bigger going on, that has yet to present itself. Is it perhaps the news out of Saudi Arabia that is about to lead to a global event?
Keeping the focus on what happened in Japan: First, for market technicians, this is a perfect “outside day” reversal signal. This is when a new high is set in an uptrend, a buying climax, and the buying exhausts and weak speculative longs are quickly shaken out of positions forcing prices to lower lows than the prior day (closing near the lows). The wider the range, and the more significant the volume, the higher the likelihood that a trend reversal is underway.
With that in mind, to the far right, you can see the spike in volume for the day.
|
|
As far as the range is concerned, we discussed the significance of a 1,000 point range historically.
So technically, there’s a fair reason to bet on a reversal here for Japanese stocks here. That leaked over into European stocks today. German stocks were down 1.4%. And it looked like U.S. stocks might have the same fate today, but the “buy the dip” appetite was clearly strong. If history is any indication, we might have better levels to buy the dip. And the dips in recent history have been lucrative: sharp but quickly recovered.
Join our Billionaire’s Portfolio subscription service today to get your portfolio in line with the most influential investors in the world, and hear more of my actionable political, economic and market analysis. Click here to learn more.
|
|
May 19, 2017, 4:00pm EST Invest Alongside Billionaires For $297/Qtr
| Stocks continue to bounce back today. But the technical breakdown of the Trump Trend on Wednesday
still looks intact. As I said on Wednesday, this looks like a technical correction in stocks (even considering today’s bounce), not a fundamental crisis-driven sell-off.
With that in mind, let’s take a look at the charts on key markets as we head into the weekend.
Here’s a look at the S&P 500 chart….
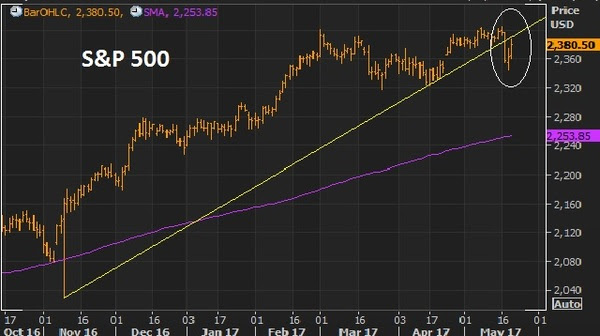
For technicians, this is a classic “break-comeback” … where the previous trendline support becomes resistance. That means today’s highs were a great spot to sell against, as it bumped up against this trendline.
Very much like the chart above, the dollar had a big trend break on Wednesday, and then aggressively reversed Thursday, only to follow through on the trend break to end the week, closing on the lows.
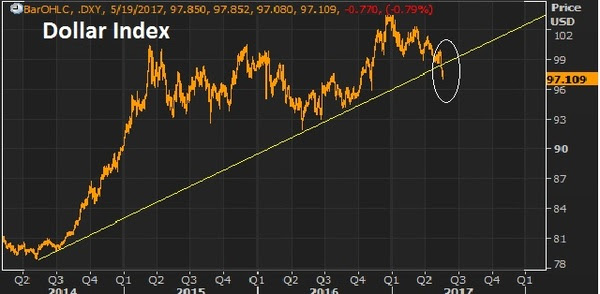
On that note, the biggest contributor to the weakness in the dollar index, is the strength in the euro (next chart).
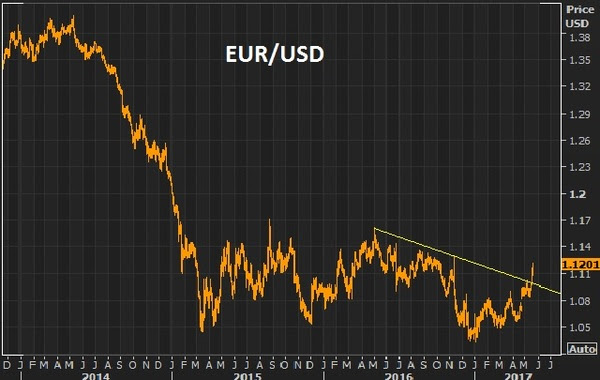
The euro had everything including the kitchen sink thrown at it and it still could muster a run toward parity. If it can’t go lower with an onslaught of events that kept threatening the existence of the euro, then any sign of that clearing, it will go higher. With the French elections past, and optimism that U.S. growth initiatives will spur global growth (namely recovery in Europe), then the European Central Bank’s next move will likely be toward exit of QE and extraordinary monetary policies, not going deeper. With that, the euro looks like it can go much higher. That means a lower dollar. And it means, European stocks look like, maybe, the best buy in global stocks.
A lower dollar should be good for gold. As I’ve said, if Trump policies come to fruition, inflation could get a pop. And that’s bullish for gold. If Trump policies don’t come to fruition, the U.S. and global growth looks grim, as does the post-financial crisis recovery in general. That’s bullish for gold.
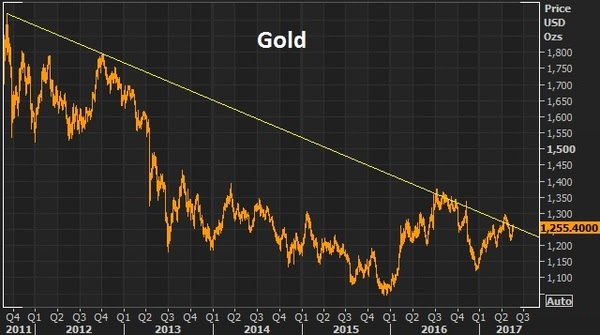
This big trendline in gold continues to look like a break is coming and higher gold prices are coming.
With all of the above, the most important chart of the week is probably this one …
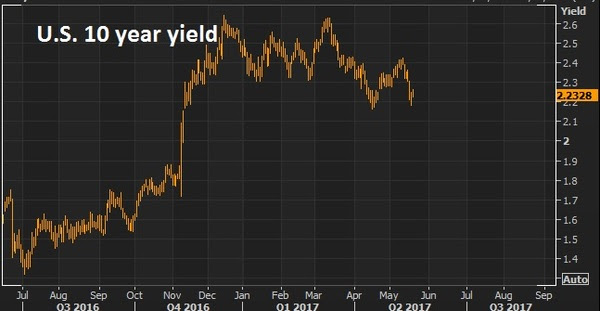
The 10 year yield has come all the way back to 2.20%. The best reason to wish for a technical correction in stocks, is not to buy the dip (which is a good one), but so that the pressure comes out of the interest rate market (and off of the Fed). The run in the stock market has clearly had an effect on Fed policy. And the Fed has been walking rates up to a point that could choke off the existing economic recovery momentum and, worse, neutralize the impact of any fiscal stimulus to come. Stable, low rates are key to get the full punch out of pro-growth policies, given the 10 year economic malaise we’re coming out of. Invitation to my daily readers: Join my premium service members at Billionaire’s Portfolio to hear more of my big picture analysis and get my hand-selected, diverse portfolio of the most high potential stocks.
|
May 12, 2017, 4:00pm EST Invest Alongside Billionaires For $297/Qtr
 As we ended this past week, stocks remain resilient, hovering near highs. The Nasdaq had a visit to the 200-day moving average intraweek for a slide of a whopping (less than) 1%, and quickly it bounced back.It’s a Washington/Trump policies-driven market now, and while the media carries on with narratives about Russia and the FBI, the market cares about getting health care done (which there was progress made last week), getting tax reform underway, and getting the discussion moving on an infrastructure spend.We looked at oil and commodities yesterday. Chinese stocks look a lot like the chart on broader commodities. With that, the news overnight about some cooperation between the Trump team and China on trade has Chinese stocks looking interesting as we head into the weekend. As we ended this past week, stocks remain resilient, hovering near highs. The Nasdaq had a visit to the 200-day moving average intraweek for a slide of a whopping (less than) 1%, and quickly it bounced back.It’s a Washington/Trump policies-driven market now, and while the media carries on with narratives about Russia and the FBI, the market cares about getting health care done (which there was progress made last week), getting tax reform underway, and getting the discussion moving on an infrastructure spend.We looked at oil and commodities yesterday. Chinese stocks look a lot like the chart on broader commodities. With that, the news overnight about some cooperation between the Trump team and China on trade has Chinese stocks looking interesting as we head into the weekend.
Let’s take at the chart…
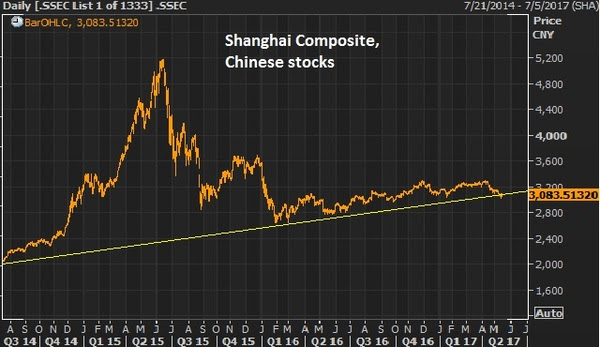
While the agreements out of China were said not to touch on steel and industrial metals, the first steps of cooperation could put a bottom in the slide in metals like copper and iron ore. These are two commodities that should be direct beneficiaries in a world with better growth prospects, especially with prospects of a $1 trillion infrastructure spend in the U.S. With that, they had a nice run up following the election but have backed off in the past couple of months, as the infrastructure spend appeared not to be coming anytime soon.
Here’s copper and the S&P 500…
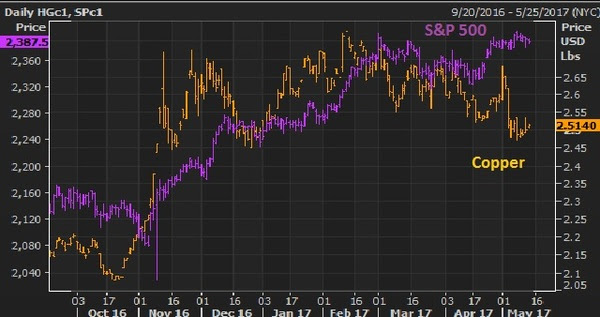
Trump policies are bullish for both. Same said for iron ore… 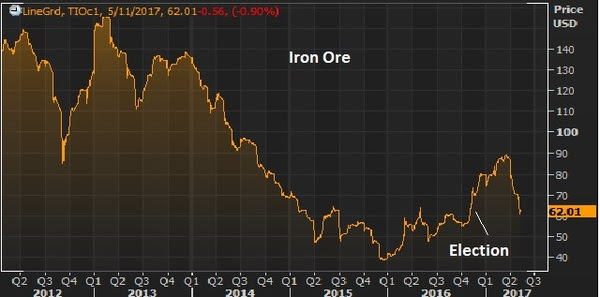
This is right in the wheelhouse of Wilbur Ross, Trump’s Secretary of Commerce. He’s made it clear that he will fight China’s dumping of steel on the U.S. markets, which has driven steel prices down and threatened the livelihood of U.S. steel producers. Keep an eye on these metals next week, and the stocks of producers.
Follow This Billionaire To A 172% Winner
In our Billionaire’s Portfolio, we have a stock in our portfolio that is controlled by one of the top billion dollar activist hedge funds on the planet. The hedge fund manager has a board seat and has publicly stated that this stock is worth 172% higher than where it trades today. And this is an S&P 500 stock!
Even better, the company has been constantly rumored to be a takeover candidate. We think an acquisition could happen soon as the billionaire investor who runs this activist hedge fund has purchased almost $157 million worth of this stock over the past year at levels just above where the stock is trading now.
So we have a billionaire hedge fund manager, who is on the board of a company that has been rumored to be a takeover candidate, who has adding aggressively over the past year, on a dip.
Join us today and get our full recommendation on this stock, and get your portfolio in line with our BILLIONAIRE’S PORTFOLIO.
|
February 28, 2017, 4:30pm EST Invest Alongside Billionaires For $297/Qtr
Markets are quiet as we head into President Trump’s address to Congress tonight. As we’ve discussed over the past week or so, the markets seem to have run the course on the outlook of fiscal stimulus and regulatory reform within an environment of a gradual rise in interest rates.
That “expectation” backdrop seems to be pretty well priced in. Now, it’s a matter of detail and timing, and that puts the new President squarely in focus for tonight.
We’ve already heard from his Treasury Secretary last week that tax reform wouldn’t be coming until August-ish. And he said we shouldn’t expect that big growth bump from Trumponomics until 2018. That’s been the first real downward management of the expectations that have been set over the past three months.
What hasn’t been discussed much is the big infrastructure spend, which is really at the core of the pro-growth policies of the Trump administration. For years, the Fed has been begging Congress for help in stabilizing the economy and stimulating growth in it — from the FISCAL side.
Given the wounds of the debt crisis, it was politically unpalatable for Congress. They ignored the calls. And as a result, just six months ago we (and the rest of the world) were dangerously close to slipping back into crisis. Only this time, the central banks would not have had the ammunition to fight it.
So now we have Congress with the will and position to act. It’s a matter of detailing a plan and getting it moving. Of the many positive things that could come from tonight’s speech by President Trump, details and timeline on fiscal stimulus would be the biggest and most meaningful.
The bickering about deficits and debt will continue, but a big stimulus package will happen — it has to happen. A government spending led growth pop is, at this stage, the only chance we have of returning to a sustainable path of growth and ultimately reducing the debt load down the line, which now is about 100% of GDP. A move back to 80% of GDP would make the U.S. debt load, relative to the rest of the world, a non-issue.
Follow The Lead Of Great Investors Like Warren Buffett In Our Billionaire’s Portfolio
In our Billionaire’s Portfolio, we’re positioned in a portfolio of deep value stocks that all have the potential to do multiples of what broader stocks do — all stocks owned and influenced by the world’s smartest and most powerful billionaire investors. Join us today and follow the world’s best investors into their best stocks. Our portfolio was up over 27% in 2016. Click here to subscribe.
January 20, 2017, 4:15pm EST
 President Trump officially took office today. From the close of business on November 8th, as people across the country were still voting, the S&P 500 has climbed 6% – from election night through today. The dollar index has risen 2.8. The broad commodities index is up 6%. The 10 year Treasury note is down 4% — which means the yield is UP from 1.80% to about 2.50%.
His policy agenda has clearly been a game changer.
But if you recall, the broad sentiment going into the election was that a Trump Presidency would cause a stock market crash. These were people that weren’t calibrating the meaningful shift in sentiment that came from projecting pro-growth policies in a world that has been starved for growth. That event (the election) alone did more to cure the global deflation risk than the trillions of dollars that central banks have been pouring into the global economy.
But many still aren’t buying it. I don’t often read financial news. I’d rather look at the primary sources (the data or hear from the actors themselves/ the horse’s mouth) and interpret for myself. But today, I had a look across the web. Four of the five top headlines on a major financial news site, on inauguration day, ranged from negative to doom-and-gloom — all laying blame on the dangers of Trump.
Because Trump has talked tough on trade, the common threat most refer to is a potential trade war. But remember, Trump has also talked tough on U.S. companies moving jobs overseas. Thus far, he hasn’t created enemies, he’s gotten concessions and has created allies. He’s used leverage, and he’s negotiated win-wins. Expect him to do the same with trade partners. With pro-growth policies coming down the pike and a meaningful pop in U.S. economic growth coming, no country, especially in the current state of the global economy, will want to be locked out of trade with the United States.
For help building a high potential portfolio, follow me in our Billionaire’s Portfolio, where you look over my shoulder as I follow the world’s best investors into their best stocks. Our portfolio more than doubled the return of the S&P 500 in 2016. You can join me here and get positioned for a big 2017.
October 31, 2016, 4:15pm EST
As we discussed on Friday, the dominant theme last week was the big run-up in global yields. This week, we have four central banks queued up to decide on rates/monetary policy.
With that, let’s take a look at the key economic measures that have been dictating the rate path or, rather, the emergency policy initiatives of the past seven years. Do the data still justify the policies?
First up tonight is Australia. The RBA was among the last to slash rates when the global economic crisis was unraveling. They cut from 7.25% down to a floor of just 3% (while other key central banks were slashing down to zero). And because China was quick to jump on the depressed commodities market in 2009, gobbling up cheap commodities, commodities bounced back aggressively. And the outlook on the commodity-centric Australian economy bounced back too. Australia actually avoided official recession even at the depths of the global economic crisis. With that, the RBA was quick to reverse the rate cuts, heading back up to 4.75%. But the world soon realized that emerging market economies could survive in a vacuum. They (including China) relied on consumers from the developed world, which were sucking wind for the foreseeable future.
The RBA had to, again, slash rates to respond to another downward spiral in commodities market, and a plummet in their economy. Rates are now at just 1.5% – well below their initial cuts in the early stages of the crisis.
But the Australian economy is now growing at 3.3% annualized. The best growth in four years. But inflation remains very low at 1.7%. Doesn’t sound bad, right? The August data was running fairly close to these numbers, and the RBA CUT rates in August – maybe another misstep.
The Bank of Japan is tonight. Remember, last month the BOJ, in a surprising move, announced they would peg the 10 year yield at zero percent. That has been the driving force behind the swing in global market interest rates. At one point this summer $12 trillion worth of negative yielding government bonds. The negative yield pool has been shrinking since. Japan has possibly become the catalyst to finally turn the global bond market. But pegging the rate at zero should also serve as an anchor for global bond yields (restricting the extent of the rise in yields). That should, importantly, keep U.S. consumer rates in check (mortgages, auto loans, credit card rates, etc.). Also, importantly, the BOJ’s policy move is beginning to put downward pressure on the yen again, which the BOJ needs much lower — and upward pressure on Japanese stocks, which the BOJ needs much higher.
With that, the Fed is next on the agenda for the week. The Fed has been laying the groundwork for a December rate hike (number two in their hiking campaign). As we know, the unemployment rate is well into the Fed’s approval zone (around 5%). Plus, we’ve just gotten a GDP number of 2.9% annualized (long run average is just above 3%). But the Fed’s favorite inflation gauge is still running below 2% (its target) — but not much (it’s 1.7%). Janet Yellen has all but told us that they will make another small move in December. But she’s told us that she wants to let the economy run hot — so we shouldn’t expect a brisk pace of hikes next year, even if data continues to improve.
Finally, the Bank of England comes Thursday. They cut rates and launched another round of QE in August, in response to economic softness/threat following the Brexit vote. There were rumors over the weekend that Mark Carney, the head of the BOE, was being pushed out of office. But that was quelled today with news that he has re-upped to stay on through 2019. The UK economy showed better than expected growth in the third quarter, at 2.3%. And inflation data earlier in the month came in hotter than expected, though still low. But inflation expectations have jumped to 2.5%. With rates at ¼ point and QE in process, and data going the right direction, the bottom in monetary policy is probably in.
So the world was clearly facing deflationary threats early in the year, which wasn’t helped by the crashing price of oil. But the central banks this week, given the data picture, should be telling us that the ship is turning. And with that, we should see more hawkish leaning views on the outlook for global central bank policies and the global rate environment.
Our Billionaire’s Porfolio is up over 15% this year — three times the return of the broader market. And each of the billionaire-owned stocks in the portfolio continues to have the potential to do multiples of what the broader market does — all led by the influence of our billionaire investors. If you haven’t joined yet, please do. Click here to get started.
October 28, 2016, 5:15pm EST
Remember, up to mid 2015, there were reasons to be optimistic about the outlook for the global economic recovery. The U.S. economy was improving. With the job market hitting targets, the Fed was preparing the world for the first rate hike, to begin moving away from emergency policies. The BOJ was keeping its promises of going full bore into an aggressive easing program which had driven the yen much lower, and stocks much higher, which was beginning to reflect in the economic data. And the European Central Bank had finally started an aggressive easing program to deal with deflationary malaise in the European economy. Better data plus continued aggressive global stimulus was reason to believe better times ahead.
But then came a jolt to markets by the Chinese making an about face on their currency (from strengthening to weakening). That created question marks about the health of China. Were things there worse than people think? And is China beginning to respond with a mass currency devaluation? That shook markets and confidence. And then we had the oil price bust early this year. That threatened mass industry defaults, and a spread to the global financial system. That shook markets and confidence. And, of course, we’ve had the surprising vote from the UK to leave the European Union (Brexit). That shook markets and confidence.
In this environment, stocks (especially U.S. stocks) are a key barometer of confidence. And it becomes self-reinforcing. When confidence shakes, stocks go lower. When stocks go lower, confidence wanes more. Weak confidence starts reflecting in weaker economic data. Weaker economic data pushes stocks lower. And the circle continues.
With this said, for much of the year, there has been speculation of another recession coming. The interest rate market had been pricing in a deflation forever story, with $12 trillion worth of global government bonds in negative yield territory at one point this past summer.
And despite the fact that the intensity of the macro concerns has abated, the fall back in the interest rate market was still sending a very cautionary signal to markets. That caution signal looks like it’s lifting. U.S. 10 year yields look like a run back above 2% is coming soon. And most importantly, the yield on German 10 year bunds (another key global benchmark interest rate) has been on a tear, exiting negative yield territory this week and running up to levels not seen since the day of the Brexit vote.
This move higher in rates, from record low levels, should be good for confidence, good for the economic outlook, and therefore good for stocks (as it removes the another cautionary cloud over sentiment).
Our portfolio is up over 15% this year — three times the return of the broader market. And each of the billionaire-owned stocks in the portfolio continues to have the potential to do multiples of what the broader market does — all led by the influence of our billionaire investors. If you haven’t joined yet, please do. Click here to get started.

August 22, 2016, 4:30pm EST
As we head into the end of August, people continue to parse every word and move the Fed makes. Yellen gives a speech later this week at Jackson Hole (at an economic conference hosted by the Kansas City Fed), where her predecessor Bernanke once lit a fire under asset prices by telegraphing another round of QE.
Still, a quarter point hike (or not) from a level that remains near zero, shouldn’t be top on everyone’s mind. Keep in mind a huge chunk of the developed world’s sovereign bond market is in negative yield territory. And just two weeks ago Bernanke himself, intimated, not only should the Fed not raise rates soon, but could do everyone a favor — including the economy — by dialing down market expectations of such.
But the point we’ve been focused on is U.S. market and economic performance. Is the landscape favorable or unfavorable?
The narrative in the media (and for much of Wall Street) would have you think unfavorable. And given that largely pessimistic view of what lies ahead, expectations are low. When expectations are low (or skewed either direction) you get the opportunity to surprise. And positive surprises, with respect to the economy, can be a self-reinforcing events.
The reality is, we have a fundamental backdrop that provides fertile ground for good economic activity.
For perspective, let’s take a look at a few charts.
We have unemployment under 5%. Relative to history, it’s clearly in territory to fuel solid growth, but still far from a tight labor market.

What about the “real” unemployment rate all of the bears often refer to. When you add in “marginally attached” or discouraged job seekers and those working part-time for economic reasons (working part time but would like full time jobs) the rate is higher. But as you can see in the chart below that rate (the blue line) is returning to pre-crisis levels.

In the next chart, as we know, mortgage rates are at record lows – a 30 year fixed mortgage for about 3.5%.

Car loans are near record lows. This Fed chart shows near record lows. Take a look at your local credit union or car dealer and you’ll find used car loans going for 2%-3% and new car loans going for 0%-1%.

What about gas? In the chart below, you can see that gas is cheap relative to the past fifteen years, and after adjusted for inflation it’s near the cheapest levels ever.

Add to that, household balance sheets are in the best shape in a very long time. This chart goes back more than three decades and shows household debt service payments as a percent of disposable personal income.

As we’ve discussed before, the central banks have have pinned down interest rates that have warded off a deflationary spiral — and they’ve created the framework of incentives to hire, spend and invest. You can see a lot of that work reflected in the charts above.
In our Billionaire’s Portfolio, we’re positioned in deep value stocks that have the potential to do multiples of the broader market—all stocks that are owned and influenced by the world’s smartest and most powerful billionaire investors. Join us today and get yourself in line with our portfolio. You can join here.
3/16/16
Central bank posturing has put a bottom in oil and stocks in the past month. Rising stocks and oil, in this environment, have a way of restoring sentiment and the stability of global financial markets. Those efforts were underpinned by more aggressive stimulus from the European Central Bank last week.
And the Fed furthered that effort today.
Just three months ago, the Fed projected that they would hike rates an additional full percentage point this year. Today they backed off and cut that projection down to just 1/2 percent (50 basis points) by year end.
That’s a big shift. In the convoluted post-QE, post-ZIRP world, that’s almost like easing.
What’s happened in the interim? Janet Yellen was asked that today and said it was: Slowing growth in China … A negative fourth quarter GDP number in Japan … Europe has had weaker growth … and Emerging markets have been weighed down by declines in oil prices.
Aside from the negative GDP print in Japan, none of these were new developments (even Japan was no shocker). Meanwhile, during the period from the Fed’s December meeting to its meeting today, oil did a round trip from $37 to $26 and back to $37.
So what happened? It appears that the Fed completely underestimated the threat of weak oil prices to the global economy and financial system. We’ve talked extensively about the danger of persistently weak oil prices, which, at sub $30 was pushing the world very close to the edge of disaster. That threat became very clear in late January/early February, culminating when the one of the biggest oil and natural gas companies in the world, Chesapeake, was rumored to be pursuing the path of bankruptcy (which was of course denied by the company). It was that moment, it appears, that policymakers woke up to the risk that the oil bust could lead to another global financial crisis — with a cascade of defaults in the energy sector, leading to defaults in weak oil exporting countries, spilling over to banks and another financial crisis.
Today’s move by the Fed, while confusing at best, led to higher stocks and higher oil prices. The market has been pricing in a much more accommodative path for the Fed for the better part of the past three months, and today the Fed dialed down to those expectations (i.e. they have now followed the ECB’s bold easing with some easier policy/guidance of their own), which should provide more fuel for the stabilization of financial markets and recovery of key markets (i.e. the continued bottoming of key industrial commodities, more stable and rising stocks and aggressive recovery in oil).
Were they just that wrong, or are they doing their part in coordinating stimulus from last month’s G20 meeting?
Bryan Rich is a macro trader and co-founder of Billionaire’s Portfolio. If you’re looking for great ideas that have been vetted and bought by the world’s most influential and richest investors, join us at Billionaire’s Portfolio.


 As we ended this past week, stocks remain resilient, hovering near highs. The Nasdaq had a visit to the 200-day moving average intraweek for a slide of a whopping (less than) 1%, and quickly it bounced back.It’s a Washington/Trump policies-driven market now, and while the media carries on with narratives about Russia and the FBI, the market cares about getting health care done (which there was progress made last week), getting tax reform underway, and getting the discussion moving on an infrastructure spend.We looked at oil and commodities yesterday. Chinese stocks look a lot like the chart on broader commodities. With that, the news overnight about some cooperation between the Trump team and China on trade has Chinese stocks looking interesting as we head into the weekend.


 President Trump officially took office today. From the close of business on November 8th, as people across the country were still voting, the S&P 500 has climbed 6% – from election night through today. The dollar index has risen 2.8. The broad commodities index is up 6%. The 10 year Treasury note is down 4% — which means the yield is UP from 1.80% to about 2.50%.


