March 8, 5:00 pm EST

Overnight, China reported a 20% plunge in its February exports.  That was the driver for a big down day for Chinese stocks — down 4.4%.  For context, this comes after a 27% run UP in the Chinese stock market since January 4th.

The export plunge was the worst reading since February of 2016.  What was happening in February of 2016?  Global stocks put in a bottom in February of 2016, after a quick and ugly 14% correction.  And the bottom was set by some central bank intervention (first the BOJ in the currency markets, then China stoking bank lending, then the Fed and the ECB followed with stimulative policies).  This time around, we are coming out of a deep slide in global stocks too, and we’ve had a similar formula of central bank support to fuel the recovery.

If anything, this Chinese export plunge is even more reason to believe that China has to make a deal, soon (i.e. a deal is getting closer).  Trump and Larry Kudlow (National Economic Advisor) both used the opportunity this morning to make that point.

Still, as I said yesterday, when stocks go down, the media is quick to revive the doom and gloom narrative.

For example, Reuters ran a story today citing some research from Bank of America.  Here’s the headline:  Worst start to the year for equity flows since 2008.

That sounds scary – the 2008 reference.  Let’s take a closer look.

Bank of America says $60 billion has been “yanked” out of equities since the start of the year.  That’s a big number, until you add some context.

Let’s take a look at this historical chart of the total market capitalization of listed domestic companies in the U.S.


The size of the U.S. stock market was just shy of $20 trillion going into the financial crisis back in 2007.  Today it’s worth $32 trillion. So the stock market is more than 50% bigger, which on a relative basis, makes the amount of money that has moved OUT of stocks this year closer to half as large as the retreat in 2007-2008.

While we are on the topic of shocking headlines, another major financial news company ran this headline and touted it on their TV coverage:  U.S. households see biggest decline in net worth since the financial crisis.

There was a drop of $3.73 trillion in the fourth quarter, compared to the third quarter.  Another scary headline.

But as you can see, household net worth is up almost $40 trillion since the pre-financial crisis peak or 58% bigger.  That makes a $3.7 trillion contraction a small blip on the chart.  And, of course, the driver of the losses was solely a stock market rout in December (which has now been largely recovered).

Join me here to get my curated portfolio of 20 stocks that I think can do multiples of what broader stocks do, coming out of this market correction environment.

March 7, 5:00 pm EST

Stocks continue to back off after completing a full recovery of the December declines.

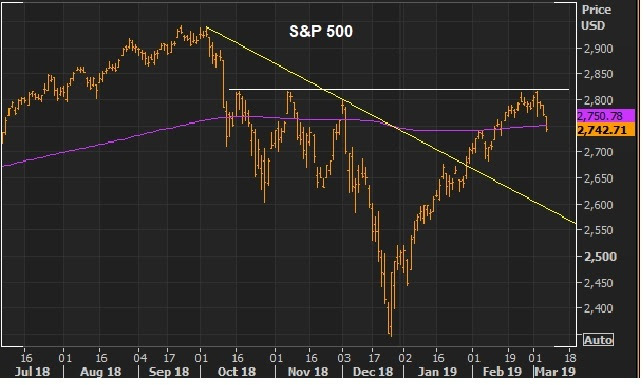
Here’s another look at the chart we observed on Monday, where you can see the big technical area of resistance (three prior highs) — and today we close back on the 200-day moving average (the purple line).

As we discussed on Monday, the failure of this level shouldn’t be too surprising, as a reasonable technical area to take some profits.

As stocks slide back, the media is quick to turn the attention back toward fears of global economic slowdown.  What’s the big difference between now and December?  The Fed has moved from telegraphing rate hikes to ‘neutral’ and sitting/watching.  The PBOC (central bank in China) has done more to stimulate their economy (to incentivize bank lending) and this morning, the ECB has come in with more easy money policies.  Both the Fed and ECB were pre-emptive shots.

Like 2016, the response from central banks has been aggressive and coordinated to ward off slowdown and/or a stock market destabilization.  That recipe worked well in 2016.  I suspect it will work well this year.

Join me here to get my curated portfolio of 20 stocks that I think can do multiples of what broader stocks do, coming out of this market correction environment.

March 6, 5:00 pm EST

Yesterday we talked about the big IPO agenda for the year.

We have some big Silicon Valley “disrupters” set to go public this year, including Lyft, Uber, WeWork and Airbnb.

Remember, these companies emerged from a post-Great Recession world, where pension funds and sovereign wealth funds were flooding money into Silicon Valley, following the money and regulatory favor from the U.S. government.  Of the $800 billion fiscal stimulus response to the financial crisis, the Obama administration doled out $100 billion worth of funding and grants for “the discovery, development and implementation of various technologies.”  The money followed it, and the private market valuations soared.

Were they based on reality or hype and too much money chasing the dream of the next Facebook?

Let’s take a look today at how the big “disrupters” of the past two years have fared, after much anticipated IPOs.

Dropbox:  Dropbox was priced at $21 per share.  It started trading at over $28.  Today it trades at $22.

Spotify:  Priced at $165.90 per share.  It started trading at $164.  It currently trades at $146.

Snap: Priced at $17 per share.  It started trading at $22.  Today it trades at $9.90.

Nothing good for the average investor that picked up these shares when these stocks went public.

Who has gotten rich? The founders.

The founder of Dropbox is worth $2.3 billion.  His company lost half a billion dollars last year on $1.4 billion in revenue.  Revenue growth is slowing to a near mortal 25% growth rate – and losses are widening dramatically.

Spotify’s founder is now also worth about $2.3 billion.  Revenue growth is slowing too to unexciting levels, and the company is still losing money.

What about Snap?  The Snap founder is worth over $2 billion.  Snap lost $1.2 billion last year, on $1.1 billion in revenue. Revenue growth has gone from 600%, to 100%, to 43% last year.

The hyper-growth valuations are unlikely to get hyper-growth.  I suspect we might see the same with the roster of IPOs this year.

Join me here to get my curated portfolio of 20 stocks that I think can do multiples of what broader stocks do, coming out of this market correction environment.

March 5, 5:00 pm EST

There’s a lot of excitement about the building IPO docket for the year.  Let’s take a look of the lay of the land …

There is said to be more than 220 companies planning to go public in 2019.

On Friday, Lyft filed an S1 with the SEC (a prospectus like document) in preparation for an IPO.  This will be the first Silicon Valley darling to go public this year.

Lyft is the second largest ride-sharing company — owns about a third of the U.S. market, with Uber owning the rest.  Uber is expected to go public this year.  The other big ones coming:  Airbnb, WeWork and Palantir.

We’ve clearly had a boom cycle in Silicon Valley over the past decade.  But are these IPOs coming late the party?

Remember, we have an administration in Washington that has tightened the regulatory screws on the dominant publicly-traded tech giants (Facebook, Amazon, Google).  The regulatory tailwinds (or lack thereof) that they enjoyed along the path of their disruptive growth, have now turned into headwinds.  And the stocks have all been hit, as a result.

Keep in mind, the private market valuations were pumped-up in these IPO candidates when public equity markets were offering little optimism about future returns.  With that, pension money was flowing into the coffers of Silicon Valley private equity firms.  And private equity fund managers were throwing money at things — and companies have been burning through that money, ramping staff, buying fancy offices and inundating us with blitz advertising campaigns.

Safe to say there has been an overhyping of the term “disrupters.”  In many cases, we’re looking at startups trying to underprice and outspend (with our pension money) in a traditional business, without having the hurdle of making money (maybe ever).  Not surprisingly, there have been market share wins.

But public companies tend to be held to a standard: profitability.  We’ll see how they do with the shifting market environment (i.e. late cycle Silicon Valley).

Lyft will be an early indicator.  Its last private investment valued the company at $15.1 billion.  For that, in their filing, they revealed a company doing a little over $2 billion in revenue, while losing almost a billion dollars last year.  Revenue growth has been slowing, losses have been widening as the private equity investors attempt to cash out in the public markets.

Join me here to get my curated portfolio of 20 stocks that I think can do multiples of what broader stocks do, coming out of this market correction environment.

March 4, 5:00 pm EST

Stocks sold off sharply this morning, before bouncing nicely from the lows.   The range on the day was the third largest of the year.

The question:  Was the selling today technically-driven or was there a catalyst that introduced new risk into the market (i.e. something bigger)?

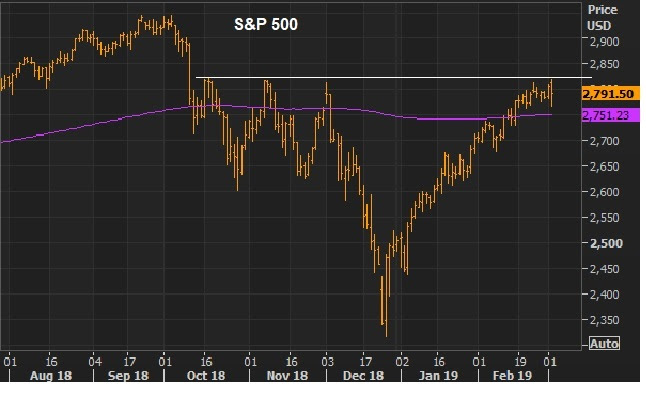
Let’s take a look at the chart …

With this sharp V-shaped recovery of the past two months, we have stocks testing these highs, and failing today.

But the failure of this level (for the moment) shouldn’t be too surprising.  Following a runup of 20%, for some this is a reasonable technical area to sell some/ to take profit.

But is there more to the sell-off this morning?

We did get an announcement that the Congressional Judiciary Committee has launched an investigation into the Trump administration.  It includes document requests from 80 people/entities tied to the administration.  They will be looking at obstruction of justice, public corruption and abuse of power (the latter of which, might be the most subjective and, therefore, threatening).

After all of the allegations and political mudslinging surrounding Trump, could this pose the biggest risk to the Trump administration and policymaking yet?  Possibly.

Congress has a unchallengeable investigatory and subpoena power.  They can dig as deeply and broadly as the want, and create as much havoc as they want, which means this may dominate what happens on Capitol Hill until the 2020 election.

Now, with all of this said, if we look at the market reaction today, as a proxy for how the market is digesting this — we did not see across the board selling.  That’s good.  If we look inside the U.S. stock market, most active stocks were a mix of up and down on the day (including up days Apple, Facebook, Baba and Amazon).  That’s good.  And foreign stocks were less impacted by the early swing in U.S. stocks.  That’s good. The emerging market futures index MXEF actually finished at the New York close UP from Friday’s close.

Join me here to get my curated portfolio of 20 stocks that I think can do multiples of what broader stocks do, coming out of this market correction environment.

March 1, 5:00 pm EST

As we end the week, let’s take a look at some key charts …

We finish the week with stocks trading at 16.5 times the Wall Street estimate on 2019 earnings.

That’s cheap in an economy running at 3.1% growth (for full 2018) and with the with the 10-year yield back well below 3%.

Here’s a look at yields …

As you can see, this important line continues to hold in yields, from the run-up following the optimism surrounding Trumponomics.

And here’s a look at stocks …

The important trend in stocks that held in December is from the global financial crisis-induced lows of 2009. This describes the global economic recovery.  A break of this trend would have spelled trouble.  But as we know, policymakers have reminded us that they will still, even 10-years following the crisis, do whatever it takes to keep the recovery going (and stocks are an important driver).  With that, we have another nice “V” on this 10-year uptrend.

Next, we’ve talked about the Chinese stock market as a key clue in measuring China’s willingness to make the necessary concessions to get a trade deal done. 

We finish the week on the highs, now up 23% from the lows of January.

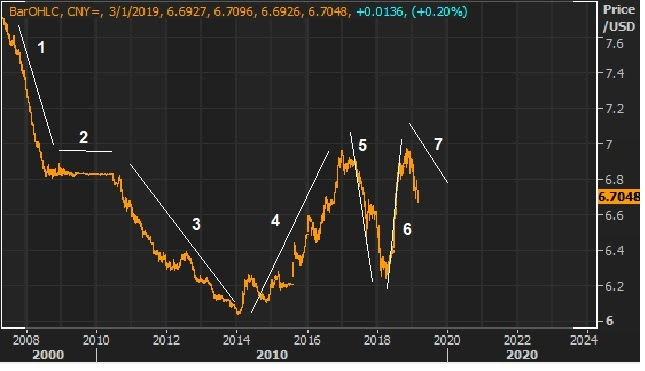
And here’s a look at the other key proxy on U.S./China trade … the Chinese currency.

In the chart above, the falling line represents a strengthening yuan versus the U.S. dollar.

China’s currency manipulation (i.e. weak currency policy) is at the core of the global trade imbalances that precipitated the global financial crisis.  With that, the currency is a key piece of the trade and structural reform demands from the Trump administration.

You can see how China has been maneuvering to pacify currency tensions over time:
1) They slowly allowed the currency to climb (against the dollar) following threats of a big tariff on China from Graham and Schumer (yes, Schumer) back in 2005.
2) When the global economic crisis hit, they went back to a peg to protect their ability to export.
3) They went back to a slow crawl higher as tensions rose, and people began to believe the developed market economies might be passing the torch to China for economic leadership.
4) It became clear that China can’t grow fast enough in a world where developed market economies are struggling. So, they went back to weakening the currency to protect their ability to export.
5) They strengthened the yuan when Trump was elected to try to ward off a trade war.
6) Trump wasn’t placated and tariffs were launched. They weakened the currency with the idea that a threat of a big one-off devaluation in the currency might create some leverage.
7)  After trying to hold-out, it has become clear that they need to get a deal done, as the economy continues to sink.  They’ve been walking the currency higher again – a signal, along with stocks, that they are willing to make aggressive concessions to get a deal done.

Join me here to get my curated portfolio of 20 stocks that I think can do multiples of what broader stocks do, coming out of this market correction environment.

February 28, 5:00 pm EST

We end the month of February today, continuing the big recovery for stocks.

After a decline of 10% in December.  We were UP 9% in January and UP 3% in February.

As we’ve discussed, the sentiment data is volatile and can take a hit when stocks fall, but it takes more sustained declines to damage the fundamental strength of the economy.  Still, the media and Wall Street are good at exaggerating the downside.  And with that, we’ve had expectations on economic data (as well as the earnings data) dialed down.  That’s good, because it sets the table for positive surprises, and we had one this morning.

The fourth quarter GDP number came in hotter, at 2.6%.  The consensus view was for 2.3%.  So here’s what full year 2018 looks like …

Q1: 2.2%
Q2: 4.2%
Q3: 3.4%
Q4: 2.6%

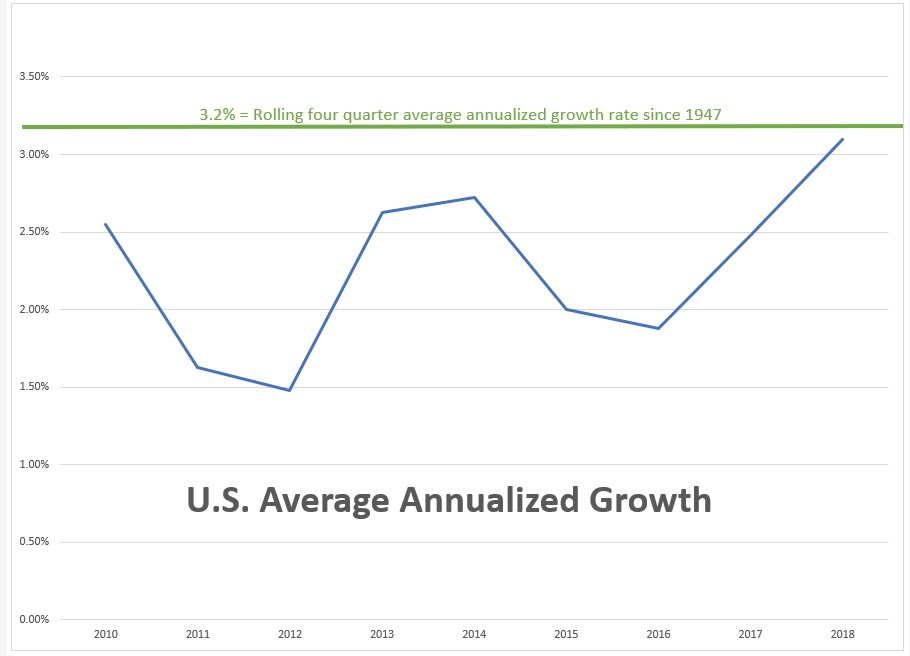
This gives us an average annualized growth of 3.1%.  The average annualized growth coming out of the Great Recession (pre-Trumponomics) was just 2.2%.

Below is what that growth has looked like against the long-term trend growth, dating back to 1947 (long-term trend growth = 3.2%).
So, we are finally approaching trend growth in 2018.
What were the experts thinking as we entered last year?

The Fed and Wall Street were looking for 2.5% growth. They undershot.

For 2019, the Fed is looking for just 2.3% growth — that was adjusted down in their December projections as they were witnessing the sharp decline in stocks.  A Wall Street Journal poll of economists back in December also showed a 2.3% growth forecast for 2019.

Again, the bar has been set low.

With that in mind, consider this:  The next big pillar of Trumponomics is a trillion-dollar-plus infrastructure spend.
Just as expectations have been dialed down, this is where we could see a real economic boom kick in, especially if we get a deal on China (clearing that drag on sentiment).
We’re already well overdue for an economic boom period.  Forperspective, let’s revisit this look at growth following the Great Depression and growth following the Great Recession …
Join me here to get my curated portfolio of 20 stocks that I think can do multiples of what broader stocks do, coming out of this market correction environment.

February 27, 5:00 pm EST

Yesterday Trump talked down oil prices.  Today oil prices came right back.

We’ve had a full recovery in stocks from the sharp declines to end the year.  Will oil prices also have a full recovery, back to the mid $70s?

My bet is yes, maybe much higher if we get a deal on China (and therefore an upside surprise on global growth).

Let’s take a look at this oil/stocks relationship.

You can see in the chart above, stocks and oil went down together. This is no coincidence.

Remember, a trigger for the decline in stocks from the top (October 3rd) was the implication of the Saudi Crown Prince in the murder of the journalist, Jamal Khashoggi.  Oil topped the same day, and then accelerated the day Trump spoke with the Saudi Crown Prince on the phone on October 16. Oil opened that day at $72 and hasn’t seen the level since (forty-three days later it was trading at $42).

With that, as I’ve said over the past several months, while the Fed always likes to exclude oil prices in their formula for measuring inflation, oil prices matter (a lot).  They mattered a lot in 2016 when oil prices crashed to $26.  That set off deflationary fears around the world and led to over $12 trillion in negative interest rates on global government bonds – and a response from global central banks.

So now we have another response from the Fed (and global central banks) — responding to stocks and the deflationary pressures of lower oil.

And now, importantly, the threat of sanctions on the Saudi government have now passed (which was a danger to global markets).  Trump settled on sanctions that exclude the Crown Prince and broader government.

With that, I suspect, this move above $55 in oil will sustain and lead to a catch up of the orange line in the chart, to the green line in the chart.

Join me here to get my curated portfolio of 20 stocks that I think can do multiples of what broader stocks do, coming out of this market correction environment.

February 26, 5:00 pm EST

Jay Powell (the Fed Chair) is on Capitol Hill this week, giving his semi-annual testimony to Congress.  He reported today to the Senate Banking, Housing and Urban Affairs Committee.  Tomorrow he will sit before the House Financial Services Committee.

Remember, it was on January 4th that the Fed marched out Powell, Yellen, and Bernanke at an economic conference to reset the market expectations on monetary policy (moving from a four rate hike forecast for 2019 to a ‘wait and see’ approach).   In response to the stock market drubbing of December, it was a clear message that the Fed is done raising rates.

With that, there was nothing new today (nor should there be tomorrow, from Powell).  The Fed will do whatever it takes to keep the economic recovery going.  At the moment, that means promoting stable, low rates and a flexibility to do whatever is necessary.

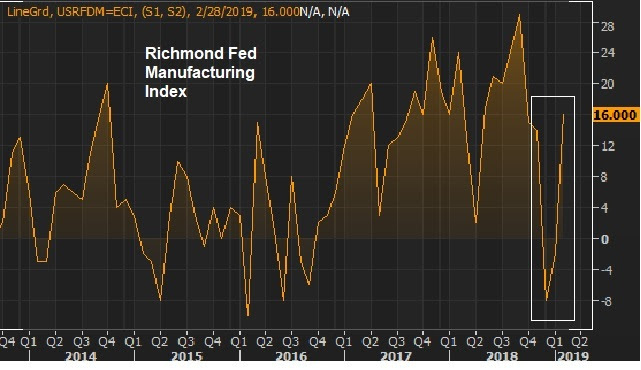
Remember, we’ve talked in recent weeks about some of the negative economic data hitting (from December), that reflects the souring of economic sentiment from the sharp December decline in stocks.  But as I said, given the sharp V-shaped recovery in stocks we’ve seen since, we should “expect this data to bounce back just as sharply.”  We’re getting a taste of it this morning.

February manufacturing data from the Richmond Fed came in with a huge positive surprise.  And the consumer confidence index followed a decline in January with a big upside surprise in February.

We have a V in stocks.  And you can see the V in the data …

We’ll get the first look at fourth quarter GDP on Thursday (which will later be revised twice).  The market has been looking for 2.5% which would give us better than 3% growth for the full year 2018.  That’s “trend growth.”  And for perspective, for those unable to block out the media and political noise, that’s nearly DOUBLE the average growth of the past ten years.

Join me here to get my curated portfolio of 20 stocks that I think can do multiples of what broader stocks do, coming out of this market correction environment.

February 25, 5:00 pm EST

As we ended last week, we talked about the important signals given from Chinese markets on the prospects of a U.S./China trade deal.

Chinese stocks and the Chinese currency have been signaling China is prepared to make the necessary concessions to get a deal done.

We opened the week with more positive news on that front.  That has driven the S&P 500 back above the December 3rd highs (just before the market collapsed 20% in 15 days).

So we’ve now had a full recovery of the December losses.  But we remain 5% off of the all-time highs.  Where do we go from here?

Let’s take a look at the breadth of participation in this recovery for stocks, for clues. As we know, by design, the big market cap stocks contribute significantly to the performance of the S&P 500 (a cap weighted index).  With that, in recent years, we’ve had booms in the tech giants that have masked weakness across broader stocks.  It has been a market of some winners, and many losers.

That dynamic is changing.  As of Friday’s close, if we looked at the equal-weighted S&P 500 index, it was up 14%.  That’s a straight average performance of every constituent stock in the index.  That compares to plus 11% for the cap-weighted index.  This is the benchmark index we always hear about — deemed to be the proxy on global economic health and stability.

So what does the outperformance in the equal weighted index tell us?

It tells us that finally there is broad-based participation in the stock market.  And I would argue, it’s telegraphing a real-broad based economic boom, supplanting the “winner takes all (gutting of industries) boom” we’ve seen over the past decade (i.e. the rise of the big tech “disrupters” thanks to regulatory negligence).

A more broadly followed breadth indicator, the advance-decline line, shows the number of stocks advancing versus those declining.  And that indicator is hitting record highs.  This indicates a healthy stock market, not a topping stock market.

Join me here to get my curated portfolio of 20 stocks that I think can do multiples of what broader stocks do, coming out of this market correction environment.