May 7, 5:00 pm EST

As we get closer to the hard deadline on a U.S./China trade deal, markets are adjusting for the potential of a no deal/ tariff escalation.

What does that look like?  U.S. stocks are now off 2% from the highs of the year.  That still puts us up 15% year-to-date.

The bigger adjustment is coming in China.  As we discussed yesterday, China is in the position of weakness in these negotiations.  The U.S. economy is strong.  China’s economy has been very weak.  A more expensive and indefinite trade dispute puts downward pressure on both economies (and the global economy), but it puts the Chinese in dangerously slow economy — which becomes politically dangerous for the Chinese Communist Party.

As such, here’s what Chinese stocks have done in the past eight days …


And, perhaps as a warning shot, China is starting to move their currency.

As we’ve discussed, China has used their currency (a weak currency) as the primary tool to achieve their extraordinary economic ascent over the past two decades — cornering the world’s export market.

We should expect, when their backs are against the wall, with a dim economic outlook, they will go back to weakening the yuan.  That’s what they have been doing since Trump’s tariff threat on Sunday.  They adjusted down the yuan yesterday by almost 1%.  That doesn’t sound like much, within China’s currency regime, it’s a big move.  We saw a one-off move like that once last year.  The other time was August of 2015, which led to fears that China might devalue the yuan. That set off a global market rout.

With the above said, China is sending Hui for the meetings that are scheduled to run Thursday and Friday.  Hui has been the point-man on trade negotiations.  His presence, in light of the tariff threats, give some encouragement that China has intentions to get a deal done.

If you haven’t signed up for my Billionaire’s Portfolio, don’t delay … we’ve just had another big exit in our portfolio, and we’ve replaced it with the favorite stock of the most revered investor in corporate America — it’s a stock with double potential.

Join now and get your risk free access by signing up here.

May 6, 5:00 pm EST

Late last week, the White House floated the idea that a trade agreement with China could come by this coming Friday (May 10).

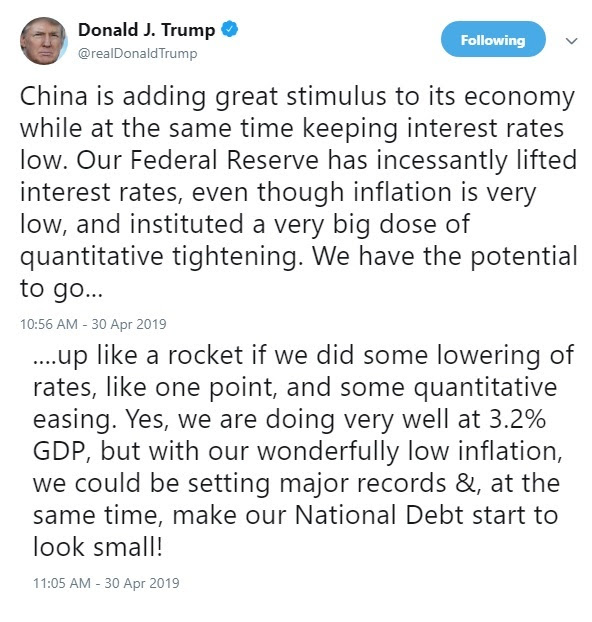
And then Trump did this yesterday …


Why would Trump risk complicating a deal, even more, by threatening China with a deadline/ tariff increase?  Because he has leverage.  He has a stock market near record highs, and a strong economy and the winds of ultra-easy global monetary policy at his back.

China, on the other hand, has an economy running in recession-like territory, with key data just (recently) bouncing from global financial crisis era levels.  And Chinese stocks, after soaring 34% since January 4th, have given back 12% from the highs, in just seven days.  And they’ve just fired a ton of fiscal and monetary policy bullets to stimulate the economy – which could be diluted by a more expensive and indefinite trade war.

So, Trump has a win-win going into the week.  If the threat works, he gets a deal done, and likely gives less to get it done.  If China backs off, stocks go down, and he gets the Fed’s rate cut he’s been looking for – stocks go back up.

If you haven’t signed up for my Billionaire’s Portfolio, don’t delay … we’ve just had another big exit in our portfolio, and we’ve replaced it with the favorite stock of the most revered investor in corporate America — it’s a stock with double potential.

Join now and get your risk free access by signing up here.

May 3, 5:00 pm EST

If you are a regular reader of my daily notes, you’ll know we’ve been discussing the setup for positive surprises all year.

As we’re near the end of Q1 earnings season, clearly we’re getting it. With 78% of the companies in the S&P 500 now reported on Q1 earnings, 76% have beat earnings estimates.

And we’re getting positive surprises in the economic data.  We had a huge positive surprise for Q1 GDP this week.  And today we had a blow out jobs report.

There were 263k jobs added in April.  The market was expecting just 185k.  That gives us a 12-month average of 218k, well above pre-financial crisis average monthly job growth!  The unemployment number was 3.6% — the lowest since 1969.

Remember, we’ve been told all year long that we were headed for both earnings and economic recession.  It’s not happening.

Moreover, the two missing pieces of the economic recovery puzzle, have been productivity and wage growth.  And these pieces are emerging. Wage growth has been on the move for the past 18 months, now sustaining above 3%.   And we had a huge positive surprise in productivity this week.

With the above in mind, given the contrast of media narrative and reality, how are people getting it so wrong?   I suspect we are seeing plenty of people make the mistake of letting politics cloud their judgement on the economy and the outlook for stocks.

May 2, 5:00 pm EST

We talked about the technical reversal signal in stocks that developed yesterday, following the Fed press conference.

Stocks continued lower today.  We’ve now had a quick 2% decline from the top.

And now we have this technical breakdown in oil as well (the break of the yellow trendline from the Dec lows). 


In the post-financial crisis world we live in, oil prices going down is generally representing a gloomier outlook on global growth and global demand.  Oil prices going up is good news — representing a hotter demand/hotter growth outlook.  And as you can see below, oil prices and stock prices have tended to move together. 

The recovery in oil prices has been almost in lock-step with the recovery in stocks (aggressively bouncing).  Crude is up 57% in four months.

Now, yesterday I asked the question:  Can stocks force the hand of the Fed, again (i.e. can lower stocks force a rate cut from the Fed)?

If oil prices were to fall hard from here, then maybe.  Why?  The Fed is afraid of deflationary pressures.  And while they like to talk about their assessment of inflation, excluding the effects of volatile oil prices, they have a record of acting on monetary policy when oil prices are falling quickly — especially in this post-crisis environment where deflation has been a persistent threat throughout.  They acted in 2016, and they’ve acted in early 2019 — in both cases taking projected interest rate hikes off of the table.

But the case for another crash in oil prices isn’t there.  We continue to have supply cuts outside of the U.S. (OPEC and non-OPEC countries).  Trump has recently stepped up sanctions against Iran, with the goal of taking Iranian oil exports to zero.  That takes supply out of the market.  And the political crisis in Venezuela has created supply disruptions for the oil market.

The shale industry is expected to plug the supply gap.  As it stands, the shale industry may or may not be able to.  But keep in mind, oil demand has been estimated on what is (and has been) low expectations for the global economy.  If we’ve seen a bottom in China, it would set up for positive surprises in the global economy. And that means the supply necessary to meet global oil demand, would be underestimated.  With that, higher (if not much higher) oil prices  from here remain the higher probability scenario.

If you haven’t signed up for my Billionaire’s Portfolio, don’t delay … we’ve just had another big exit in our portfolio, and we’ve replaced it with the favorite stock of the most revered investor in corporate America — it’s a stock with double potential.

Join now and get your risk free access by signing up here.

May 1, 5:00 pm EST

As we discussed yesterday, the interest rate market has been signaling that the Fed made a mistake in December, when it hiked rates one last time, into a stock market that was in a steep decline.

In today’s post-Fed meeting press conference with the Fed Chairman, markets were expecting signals from Jay Powell that they might be looking to take that hike back, if the current subdued inflation levels persisted.  But Powell was reluctant to give much of a leaning toward a cut.  In fact, he said the risks that precipitated their “pause” on the rate path (China and European growth, Brexit risks, and trade negoations), have been largely improving.  He’s right.  He said the economy was solid.  He’s right.

Still, stocks came off sharply into the close.

After today, you have to ask the question:  Can stocks force the hand of the Fed, again?  Remember, stocks fell 8% in just four trading days after the Fed’s December hike – penalizing a tone deaf Fed.  In a market that was already down 9% on the month, the slide was exacerbated by the further Fed tightening. 

That stock fallout soon led to a response from the U.S. Treasury, as Mnuchin called out to major banks and the President’s Working Group on Financial Markets (which includes the Fed) to “assure normal market operations.”  That put a bottom in stocks.  And within days of that, the three most powerful central bankers of the past ten years (Bernanke, Yellen and Powell) were backtracking on the Fed’s rate path — signaling a pause.  The Fed’s pivot has fueled a V-shaped recovery in stocks.

So, we’ve just come off of a four-month run in stocks that gave us a full recovery of the late 2018 losses — and a new record high in the S&P 500.  That was the best four month gain since 2010.  Now we enter May with this chart …


As you can see, with the decline this afternoon, the S&P 500 put in a key reversal signal — a bearish outside day.  That’s tough to ignore, given that we’ve had a 16% gain in stocks to open the first four months of the year. This signal may be enough to stop the momentum, for now, as we wait for the word on a China deal — which is now said to ‘possibly’ come by next Friday.

If you haven’t signed up for my Billionaire’s Portfolio, don’t delay … we’ve just had another big exit in our portfolio, and we’ve replaced it with the favorite stock of the most revered investor in corporate America — it’s a stock with double potential.

Join now and get your risk free access by signing up here.

April 30, 5:00 pm EST

As we head into a Fed decision tomorrow, we’ve talked about the prospects of a Fed rate cut.  It’s highly unlikely.

It’s even more unlikely today, after Trump pushed for, not just a cut, but a full point cut …


Unfortunately, the influence Trump tried to wield late last year, is probably why the Fed hiked in December — just to prove to the world that they (the Fed) wouldn’t be politically influenced.

With that, we now have an economy growing at 3%+, stocks near record highs and subdued inflation.  And yet we have a ten-year yield at 2.5%.  It doesn’t fit.  The interest rate market is still sending the message that the December rate hike was a mistake.

With that, if we did get a cut by this summer, I suspect the interest rate market would adjust to reflect a more optimistic economic outlook.  By that, I mean, with a cut in the Fed funds rate, the long end of the yield curve (specifically, 10-year yields) would probably go UP not down –steepening the yield curve.

If you haven’t signed up for my Billionaire’s Portfolio, don’t delay … we’ve just had another big exit in our portfolio, and we’ve replaced it with the favorite stock of the most revered investor in corporate America — it’s a stock with double potential.

Join now and get your risk free access by signing up here.

April 29, 5:00 pm EST

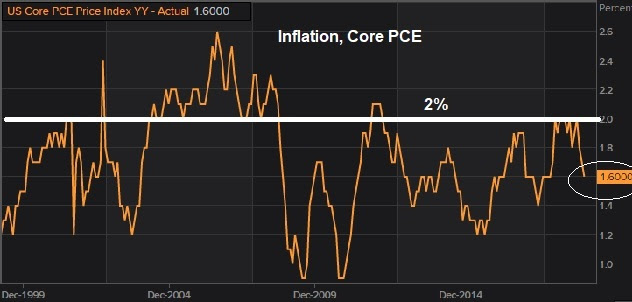
We ended last week with a positive surprise for Q1 GDP.  Today, we had more soft inflation data.

The Fed’s favored inflation gauge, core PCE, continues to fall away from it’s target of 2%.

Here’s a look at the chart …


With a Fed meeting this week, they remain in the sweet spot.  They have trend economic growth, subdued inflation and a 10-year yield at 2.5%.  They can sit and watch. They could cut!   That’s highly unlikely, but less unlikely by the summer, if current conditions persist.

The market is pricing in about a 60% chance that we’ll see a rate cut by year-end.  It doesn’t sound so crazy, if you consider that it would underpin/if not ensure the continuation of the economic expansion — perhaps even fueling an economic boom period.

Remember, we’ve talked about the 1994-1995 parallels. In 1994, an overly aggressive Fed raised rates into a recovering, low inflation economy.  By 1995, they were cutting.  That led to a 36% rise in stocks in 1995.  And it led to 4% growth in the economy through late 2000 — 18 consecutive quarters of 4%+ growth.  Stocks tripled over the five-year period.

This, as the S&P 500 is already sitting on new record highs?  As I said earlier this year, with yields back (well) under 3%, we should see multiples on stocks expand back toward 20x in this environment.

The forward 12-month P/E on the S&P 500 is currently 16.8.  If we multiply Wall Street’s earnings estimate on the S&P 500 ($175) times a P/E of 20, we get 3,500 in the S&P 500. That’s 19% higher than current levels.

But keep in mind, the earnings estimate bar has been set low.  And already 77% of companies are beating estimates on Q1 earnings.  I suspect, we’ll see higher earnings over the next twelve months than Wall Street has estimated, AND a higher multiple paid on those earnings (i.e. an outlook for an S&P 500 > 3,500).

If you haven’t signed up for my Billionaire’s Portfolio, don’t delay … we’ve just had another big exit in our portfolio, and we’ve replaced it with the favorite stock of the most revered investor in corporate America — it’s a stock with double potential.

Join now and get your risk free access by signing up here.

April 26, 5:00 pm EST

The first reading on first quarter U.S. GDP came in this morning at 3.2%— much better than expected.  This is a huge positive surprise, for what many expected to be a terrible quarter.

Just a month ago, the consensus view was something closer to 1%.  Goldman was looking for 0.7% going into the end of the quarter.

With that, we’ve been talking about this set-up for positive surprises all year.

Remember, the economy added on average 173,000 jobs a month in Q1.  Both manufacturing and services PMIs expanded in the quarter, and stocks fully recovered the losses from December.  Add to that, just days into the first quarter, the Fed told us they were done raising rates.  Whatever headwinds the Fed was stirring up, quickly became tailwinds.
Yet we’ve been told an economic recession was coming and an earnings recession upon us.  The above is a recipe for growth, not contraction.

Still, as we’ve discussed, never underestimate the appetite of Wall Street and corporate America to dial down expectations when given the opportunity.  That sets the table for positive surprises.  And positive surprises are fuel for stocks.   Stocks are fuel for confidence.  Confidence is fuel for the economy.

Last week we looked at the early signals on Q1 economic activity.  The positive surprises started with what looks like the bottom in Chinese industrial output and retail sales (two key indicators of economic health). This is important because the global slowdown fears have been centered around the weak Chinese economy.

Then both UK retail sales and the U.S. retail sales came in better.  And yesterday, we had a hot durable goods orders number in the U.S for March.

So, despite the negative picture that has been painted, the trajectory of U.S. economic growth seems to be well intact.

This is just the first reading on the Q1 number, but it gives us an average annualized growth rate of three percent even.  The average annualized growth coming out of the Great Recession (pre-Trumponomics) was just 2.2%.

And keep in mind, the next big pillar of Trumponomics is a trillion-dollar-plus infrastructure spend (with bipartisan support).

Just as expectations have been dialed down, this is where we could see a real economic boom kick in, especially if we get a deal on China (clearing that drag on sentiment).  As we’ve discussed, we are well overdue for an economic boom period.  We’ve yet to have the bounce-back in growth that is typical of a post-recession, if not post-depression environment.  You can see in the table below, the six years that followed the Great Depression, relative to the growth coming out of the Great Recession …


Have a great weekend!

If you haven’t signed up for my Billionaire’s Portfolio, don’t delay … we’ve just had another big exit in our portfolio, and we’ve replaced it with the favorite stock of the most revered investor in corporate America — it’s a stock with double potential.

Join now and get your risk free access by signing up here.

April 25, 5:00 pm EST

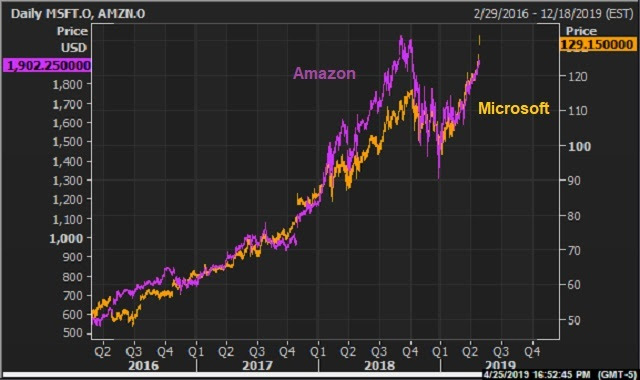
Today, Microsoft was the third company to hit the trillion-dollar market cap threshold.

Apple was the first, back in August.  Amazon followed in September.

Let’s talk about how Microsoft has transformed itself from a path of obsolescence to quadrupling in value in six years.

Back in April of 2013, an activist investor named Jeff Ubben took a $2 billion stake in MSFT.  That same month Business Insider wrote a story titled:  “Microsoft Could Be Obsolete By 2017.”  The stock had gone nowhere for more than a decade. 

Ubben won a board seat and he pushed for stock buybacks and a strategy reset.  He pushed out the CEO, Steve Balmer.  He replaced him with Satya Nadella, who was running the Miscrosoft cloud business.  His job was to turn Miscrosoft into a cloud computing company.  He has done it.

Microsoft is now the number two cloud computing platform globally, behind Amazon. For perspective, cloud computing is a $200 billion market growing at close to 20% a year.  And Microsoft’s cloud business, Azure,grew revenue by 73% last quarter.

Bottom line:  Amazon and Microsoft have a duopoly in the high growth digital storage business (i.e. cloud computing). 

Amazon’s retail business gets all of the attention, but it’s cloud business has been subsidizing it’s retail business for a long time.  The hyper-growth in cloud and the market dominance held by Amazon and Microsoft are why their market value has gone to a trillion-dollars, and why their charts look so similar …


If you haven’t signed up for my Billionaire’s Portfolio, don’t delay … we’ve just had another big exit in our portfolio, and we’ve replaced it with the favorite stock of the most revered investor in corporate America — it’s a stock with double potential.

Join now and get your risk free access by signing up here.

April 24, 5:00 pm EST

Among the big news of the day is the bidding war that is underway for the Permian Basin oil producer Anadarko.  This fits right in with my daily notes of the past two days.

Anadarko received a bid from Chevron two weeks ago for $65 a share.  Today, Occidental Petroleum offered $75 a share for the company.  Prior to the takeover bids, the stock was trading $47.  So, Occidental’s bid is a 60% premium to where Anadarko shares were trading on April 11.

Now we have this chart ….


We’ve talked about the opportunity to see a big comeback in the energy sector.  The S&P energy ETF (XLE) is the only sector ETF with a negative five-year return.

It’s common to see M&A activity ramp up in sectors that have been beaten down and misvalued.  This may be the beginning.

With that in mind, yesterday we drilled into the constituents of the XLE and highlighted the four stocks in the ETF that have been vetted and are owned by big influential activist investors.

What will these activists likely do, in light of this takeover activity?  I suspect they will push to put the companies they own on the selling block.

Let’s revisit the four stocks and the billionaire investor involved in each, and then we’ll take a look at how these companies stack up, relative to Anadarko, in output in the Permian Basin.

Devon Energy (DVN)

Billionaire Paul Singer of Elliott Management is one of the best activist investors in the world.  He has one of the longest tenures in the business, dating back to the 70s.  And he’s had one of the hottest hands on Wall Street over the past few years. Singer’s fund, Elliott Management, owns 4% of Devon.  It’s the eighth biggest long position.  Devon is down 52% over the past five years.

Hess Corp. (HES)

Singer and his team are the fourth largest shareholder in Hess.  They have a 7% stake in Hess.  And it’s a big position in the Elliott portfolio — a top five position representing over 7% of the portfolio.   Hess is down 25% over the past five years.

Pioneer Natural Resources (PXD)

Billionaire Seth Klarman has been called the next Warren Buffett.  His fund, Baupost Group, is the sixth largest shareholder of Pioneer.  Klarman has 5% of his portfolio invested in Pioneer.  Pioneer is down 14% over the past five years.

Diamondback Energy (FANG)

Billionaire Carl Icahn owns 6% of Diamondback.  It’s a half a billion dollar stake in his $20 billion portfolio.  Diamondback is up 46% — and already up 22% from when Icahn entered in the fourth quarter. 

Now, here’s how they look, ranked by annual production in Texas.

With the above in mind, and considering the $38 billion bid for Anadarko, Pioneer is the second largest producer in the state, and has a market cap of $29 billion.  Diamondback is the fourth largest producer in the state, with a market cap of $18 billion.  And Devon Energy is the 15th largest producer in Texas, with a market cap of $15 billion.  Icahn may be sitting on the biggest opportunity stock.

If you haven’t signed up for my Billionaire’s Portfolio, don’t delay … we’ve just had another big exit in our portfolio, and we’ve replaced it with the favorite stock of the most revered investor in corporate America — it’s a stock with double potential.

Join now and get your risk free access by signing up here