|
|
|
March 8, 5:00 pm EST Overnight, China reported a 20% plunge in its February exports. That was the driver for a big down day for Chinese stocks — down 4.4%. For context, this comes after a 27% run UP in the Chinese stock market since January 4th. The export plunge was the worst reading since February of 2016. What was happening in February of 2016? Global stocks put in a bottom in February of 2016, after a quick and ugly 14% correction. And the bottom was set by some central bank intervention (first the BOJ in the currency markets, then China stoking bank lending, then the Fed and the ECB followed with stimulative policies). This time around, we are coming out of a deep slide in global stocks too, and we’ve had a similar formula of central bank support to fuel the recovery. If anything, this Chinese export plunge is even more reason to believe that China has to make a deal, soon (i.e. a deal is getting closer). Trump and Larry Kudlow (National Economic Advisor) both used the opportunity this morning to make that point. Still, as I said yesterday, when stocks go down, the media is quick to revive the doom and gloom narrative. For example, Reuters ran a story today citing some research from Bank of America. Here’s the headline: Worst start to the year for equity flows since 2008. That sounds scary – the 2008 reference. Let’s take a closer look. Bank of America says $60 billion has been “yanked” out of equities since the start of the year. That’s a big number, until you add some context. Let’s take a look at this historical chart of the total market capitalization of listed domestic companies in the U.S.
|
 |
|
The size of the U.S. stock market was just shy of $20 trillion going into the financial crisis back in 2007. Today it’s worth $32 trillion. So the stock market is more than 50% bigger, which on a relative basis, makes the amount of money that has moved OUT of stocks this year closer to half as large as the retreat in 2007-2008. While we are on the topic of shocking headlines, another major financial news company ran this headline and touted it on their TV coverage: U.S. households see biggest decline in net worth since the financial crisis. There was a drop of $3.73 trillion in the fourth quarter, compared to the third quarter. Another scary headline. |
 |
|
But as you can see, household net worth is up almost $40 trillion since the pre-financial crisis peak or 58% bigger. That makes a $3.7 trillion contraction a small blip on the chart. And, of course, the driver of the losses was solely a stock market rout in December (which has now been largely recovered). Join me here to get my curated portfolio of 20 stocks that I think can do multiples of what broader stocks do, coming out of this market correction environment. |
|
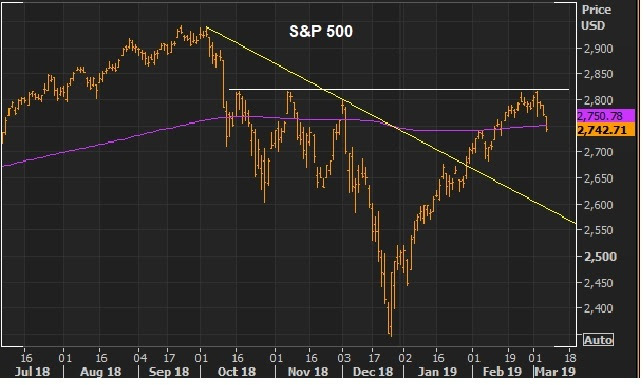
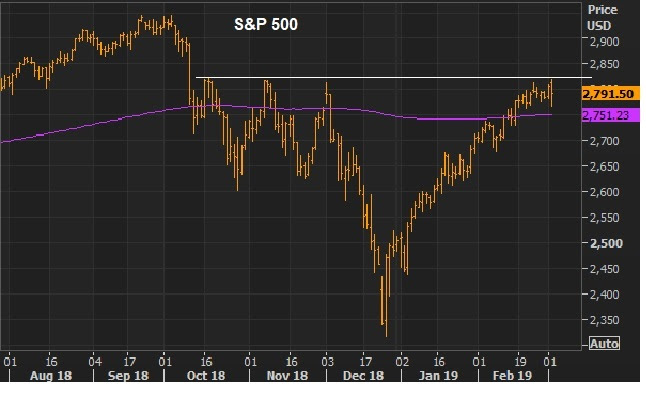
March 7, 5:00 pm EST Stocks continue to back off after completing a full recovery of the December declines. Here’s another look at the chart we observed on Monday, where you can see the big technical area of resistance (three prior highs) — and today we close back on the 200-day moving average (the purple line). |
 |
|
As we discussed on Monday, the failure of this level shouldn’t be too surprising, as a reasonable technical area to take some profits. As stocks slide back, the media is quick to turn the attention back toward fears of global economic slowdown. What’s the big difference between now and December? The Fed has moved from telegraphing rate hikes to ‘neutral’ and sitting/watching. The PBOC (central bank in China) has done more to stimulate their economy (to incentivize bank lending) and this morning, the ECB has come in with more easy money policies. Both the Fed and ECB were pre-emptive shots. Like 2016, the response from central banks has been aggressive and coordinated to ward off slowdown and/or a stock market destabilization. That recipe worked well in 2016. I suspect it will work well this year. Join me here to get my curated portfolio of 20 stocks that I think can do multiples of what broader stocks do, coming out of this market correction environment. |
|
|
|
|
|
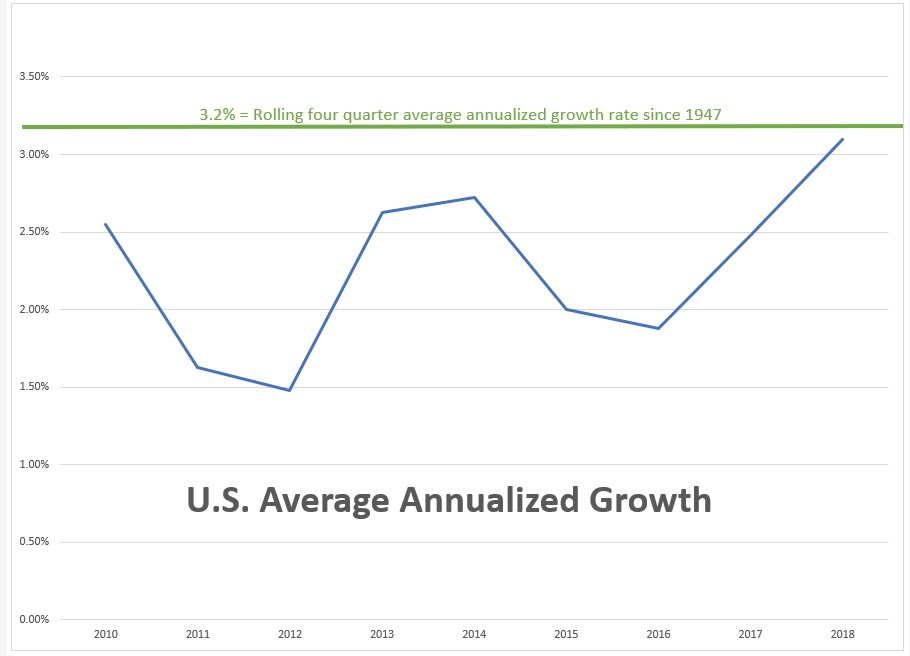
February 28, 5:00 pm EST We end the month of February today, continuing the big recovery for stocks. After a decline of 10% in December. We were UP 9% in January and UP 3% in February. As we’ve discussed, the sentiment data is volatile and can take a hit when stocks fall, but it takes more sustained declines to damage the fundamental strength of the economy. Still, the media and Wall Street are good at exaggerating the downside. And with that, we’ve had expectations on economic data (as well as the earnings data) dialed down. That’s good, because it sets the table for positive surprises, and we had one this morning. The fourth quarter GDP number came in hotter, at 2.6%. The consensus view was for 2.3%. So here’s what full year 2018 looks like … Q1: 2.2% This gives us an average annualized growth of 3.1%. The average annualized growth coming out of the Great Recession (pre-Trumponomics) was just 2.2%. Below is what that growth has looked like against the long-term trend growth, dating back to 1947 (long-term trend growth = 3.2%).
|
 |
|
So, we are finally approaching trend growth in 2018.
What were the experts thinking as we entered last year?
The Fed and Wall Street were looking for 2.5% growth. They undershot. For 2019, the Fed is looking for just 2.3% growth — that was adjusted down in their December projections as they were witnessing the sharp decline in stocks. A Wall Street Journal poll of economists back in December also showed a 2.3% growth forecast for 2019. Again, the bar has been set low. With that in mind, consider this: The next big pillar of Trumponomics is a trillion-dollar-plus infrastructure spend.
Just as expectations have been dialed down, this is where we could see a real economic boom kick in, especially if we get a deal on China (clearing that drag on sentiment).
We’re already well overdue for an economic boom period. Forperspective, let’s revisit this look at growth following the Great Depression and growth following the Great Recession …
|
 |
|
Join me here to get my curated portfolio of 20 stocks that I think can do multiples of what broader stocks do, coming out of this market correction environment.
|
|


