May 28, 5:00 pm EST

We head into the last week of May, with major global stock markets down in the neighborhood of 5% for the month.  And with major global interest rates at the lowest levels since late 2016-2017.

With this in mind, let’s revisit how we opened the month of May.

On May 1, U.S. stocks had just put up the best opening four months since 1999.  But the interest rate market was continuing signal that the Fed had made a mistake in its rate hiking campaign — specifically the December rate hike.

On a related note, we closed the first day of May with a sharp sell off in stocks, and we looked at this chart …


As you can see, the S&P 500 put in a big technial reversal signal — a bearish outside day.

With this technical setup, I said in my May 1 note:  “you have to ask the question:  Can stocks force the hand of the Fed, again?” … i.e. can a lower stock market force the Fed to cut rates — to take back the December mistake.

Here we are, twenty-seven days later, and stocks are down about 5%.  That reversal signal did indeed predict the decline.  But the decline hasn’t been messy like the slides of the fourth quarter.  It has been orderly, and I suspect it’s not forcing the Fed’s hand.

But, what may force the Fed’s hand is the the bond market.  Consider this, the last time U.S. 10-year government bond yield was at these levels, 2.25%, the Fed Funds rate was HALF of current levels (1.25% in Q3 of 2017 versus 2.5% today).  This disconnect between what the market judges to be the appropriate interest rate and what the Fed judges the appropriate level, is causing the dreaded yield curve inversion signal that is scaring markets. If things stay here, that’s probably good enough for a June (19) rate cut.

If you haven’t signed up for my Billionaire’s Portfolio, don’t delay … we’ve just had another big exit in our portfolio, and we’ve replaced it with the favorite stock of the most revered investor in corporate America — it’s a stock with double potential.

Join now and get your risk free access by signing up here.

May 24, 5:00 pm EST

We’ve talked this week about the potential for a Plaza Accord 2.0.

As we discussed, the trade war has been manufactured by more than three-decades of China’s currency war.  It only makes sense that it can only be resolved with a primary focus on the currency.  We may find that if/when the U.S./China stalemate ends, it will be with a grand and coordinated currency agreement.
Back in 1985, the U.S. was in a fight with Japan over the imbalance in trade.  The Reagan administration ultimately brokered an agreement (the Plaza Accord) between the U.S., Japan, Germany, England and France.  That resulted in a 50% devaluation of the dollar.
The China fight looks very similar.
With that in mind, we should keep a close eye on how currencies are trading.  And today, things were moving.
Global rates were very heavy today.  Stocks were heavy all day.
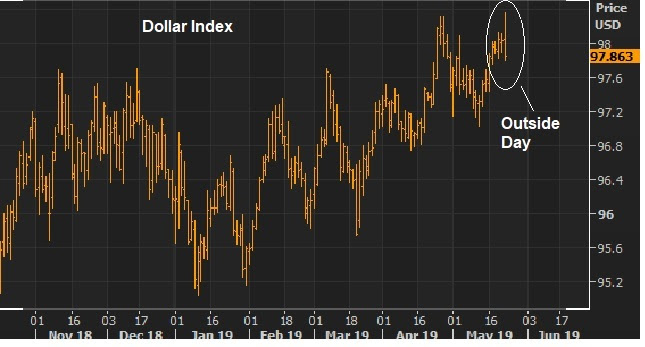
Generally, in the post-financial crisis world, that would mean a strongerdollar (i.e. a higher risk environment has tended to result in global money moving into the relative safety of dollars).  That was the case as through Asia and Europe today with the dollar hitting the highs of the past twelve months.  But when U.S. stocks opened, the dollar had a big reversal.


You can see in the chart above, the dollar index put in a bearish outside day (a key reversal signal) — something to keep an eye on for clues. 

If you haven’t signed up for my Billionaire’s Portfolio, don’t delay … we’ve just had another big exit in our portfolio, and we’ve replaced it with the favorite stock of the most revered investor in corporate America — it’s a stock with double potential.

Join now and get your risk free access by signing up here.

May 21, 5:00 pm EST

With the stalemate on U.S./China trade talks, let’s take a look today at how this may end.

A lot of attention has been given to trade quotas, intellectual property theft and the challenges U.S. companies have accessing Chinese markets.  What hasn’t been talked about as much is the currency issue.  Yet China’s currency is at the core of it all.

China has used a weak currency to leapfrog almost the entire world over the past 30+ years, capturing 15% of the global economic market share and rising to an economic power.  They’ve gone from a $350 billion economy in the early 80s, to a $13 trillion economy today (the second largest economy in the world).

That’s how they got here, and we’ve talked in recent weeks how they are attempting to stay here …. going back to what they know, weakening the currency, as a tool to fight the impact tariffs.

With that, the trade war has been manufactured by more than three-decades of China’s currency war.  It only makes sense that it can only be resolved with a primary focus on the currency.  We may find that if/when the U.S./China stalemate ends, it will be with a grand and coordinated currency agreement.

With that, a lot of comparisons have made between the U.S/China standoff and that of U.S. and Japan in the 80s.  That was ended with the “Plaza Accord” — an agreement between the U.S., Japan, Germany, England and France.  The Plaza Accord was a plan to balance global trade, through a 50% depreciation of the dollar (vs the yen and d-mark).

We may wake up one day and find a similar agreement has been made between the U.S. and major global trading partners (which may include China, or not).

If you haven’t signed up for my Billionaire’s Portfolio, don’t delay … we’ve just had another big exit in our portfolio, and we’ve replaced it with the favorite stock of the most revered investor in corporate America — it’s a stock with double potential.

Join now and get your risk free access by signing up here.

May 20, 5:00 pm EST

With nine trading days remaining in May, stocks are down about 3.5% for the month.  This follows a huge first four months from the year (up 3.9% in January, up 1.8% in February, up 3% in March and up 7.9% in April).

And for the coming week, there’s not much new information for markets to digest.  First quarter earnings season is nearly complete.  The economic data agenda for the week is very light.  And for the first time in a while, there is no expectation of incremental change in the U.S./China trade negotiations.

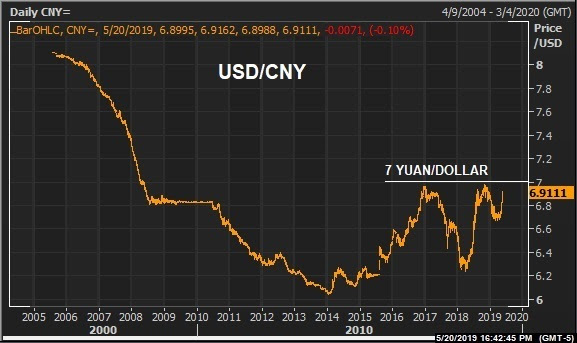
But this will likely still be the most important chart to watch this week …


The Chinese have not weakened the yuan beyond 7 (per dollar – which would be a breach of the white line) since the pre-Lehman days.

If you haven’t signed up for my Billionaire’s Portfolio, don’t delay … we’ve just had another big exit in our portfolio, and we’ve replaced it with the favorite stock of the most revered investor in corporate America — it’s a stock with double potential.

Join now and get your risk free access by signing up here.

May 17, 5:00 pm EST

China continues to move their currency lower, as a way to offset some of the burden of tariffs (reducing the price of Chinese products in dollar terms).

And we’ve seen how the trajectory of the yuan is effecting Bitcoin.  Chinese citizens are trying to get their money out and doing so through Bitcoin.

Let’s take a look at how it is effecting the price of gold.

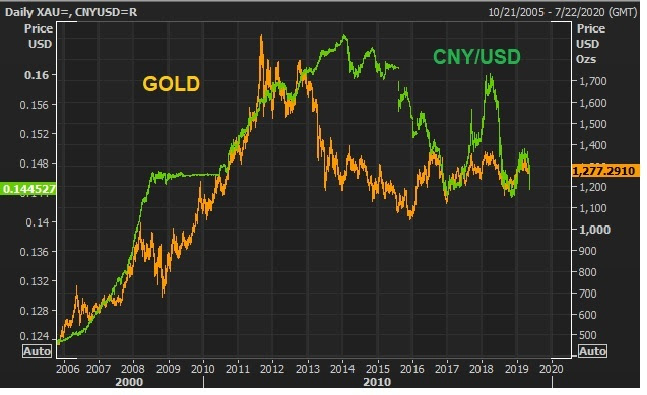
As you can see in the chart, the yuan and the price of gold have traded in a fairly close relationship.  


Of course, there are a lot of unconventional economic times incorporated in this chart (from 2006-present) — like a flight to safety in the financial crisis, which was bullish for gold. But is there anything behind the yuan – gold relationship?  It seems so.

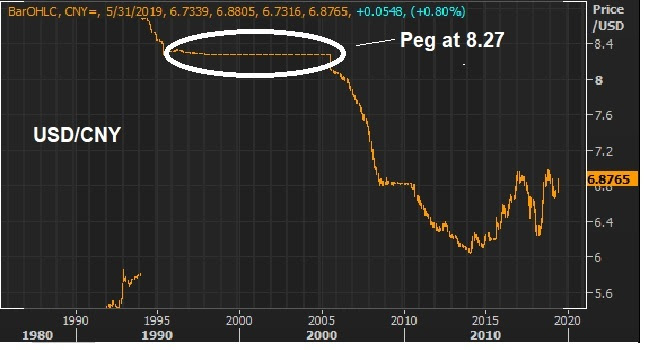
As we know the Chinese has managed the value of their currency relative to the U.S. dollar for a long time (the currency of its biggest trading partner, the global reserve currency and the global currency of trade).  From 1996 to 2005, China pegged the currency at 8.28 to the dollar.  In 2005, they went to a managed float (to pacify WTO requirements and U.S. demands), where they allowed for a gradual strengthening of the yuan.

But it also seems clear that they have managed it to the value of gold. As they weaken the yuan, they reduce their buying power of gold (i.e. their ability to print yuan, sell it for dollars and buy gold – not to mention other commodities).  So manipulating the price of gold to preserve the yuan’s buying power is plausible.

If we think to the behavior of gold while China was running the currency peg from 1996 to 2005:  Gold was in a sideways range the entire time.  Only when they moved to a managed float in 2005, strengthening the yuan, did the price of gold finally break out of the sideways range of the prior decade (higher, along with the yuan). 

With the above in mind, as China continues to walk the yuan lower, we may find the price of gold making another run toward the $1,000 level. 

If you haven’t signed up for my Billionaire’s Portfolio, don’t delay … we’ve just had another big exit in our portfolio, and we’ve replaced it with the favorite stock of the most revered investor in corporate America — it’s a stock with double potential.

Join now and get your risk free access by signing up here.

May 16, 5:00 pm EST

There’s a lot of chatter about China offloading of U.S. Treasuries.

China is the largest foreign holder of Treasuries, with a stake of $1.1 trillion.  And the latest report from the U.S. Treasury showed China, as Reuters puts it, selling “the most U.S. Treasuries in nearly two-and-a-half years.”  Sounds scary.

The dark scenario of China dumping our treasuries is not a new one.  It has been talked about for a long time as existential threat.  Surely, an increase in tariffs and a tough negotiating position from the U.S. would set this into motion. Right?

Let’s take a closer look at this threat. 


Above is a snapshot of the recent TICs report.  You can see that China has sold over the past twelve months, $67 billion worth of Treasuries.  You can also see that any sign of “systematic selling” was short-lived (five months) last year.  It came to a halt when the sell-off in global stocks elevated the risks to global stability (i.e. when risk rises, they and everyone wants to own Treasuries — the safest parking spot for global capital).

You can also see that, over the past twelve months, the other biggest holder of U.S. Treasuries, Japan, was a net buyer (of $34 billion) – as was most of the rest of the world (to the tune of $250 billion).

The take away:  Even if China were to “dump” Treasuries there are plenty of buyers.  Don’t forget, the Bank of Japan is printing yen to buy assets (domestic and global). They could buy unlimited Treasuries.  The Fed can buy more Treasuries (they already own $2 trillion worth).

As we’ve discussed, China’s tool to fight tariffs isn’t the U.S. Treasury market, it’s their currency.  And devaluing the yuan increases the value of their dollar-based Treasury holdings (in yuan terms).  But any big one-off devaluation of the yuan would likely get China’s other global trading partners more visibly into the fight.

If you haven’t signed up for my Billionaire’s Portfolio, don’t delay … we’ve just had another big exit in our portfolio, and we’ve replaced it with the favorite stock of the most revered investor in corporate America — it’s a stock with double potential.

Join now and get your risk free access by signing up here.

May 15, 5:00 pm EST

The bounce for stocks continued today.  But global yields were broadly weak.

Why?  Is this a market that’s pricing in more global central bank easing (therefore lower rates, higher asset prices)?

It might appear that way.  Trump has been asking for a rate cut.  In fact, yesterday he tried to make the case for more QE (let’s assume he means ending the Fed’s balance sheet reduction program).  The fed funds futures market has been pricing in a rate cut for a while now — now looking for a 50% chance of a cut by September and a 75% chance of a cut by year end.

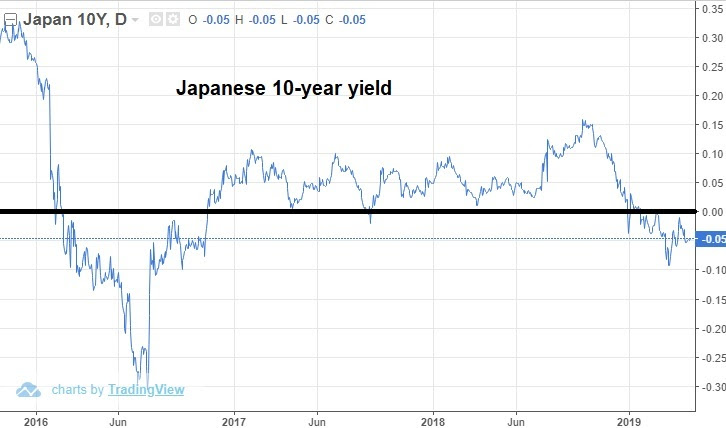
Additionally, the German 10-year yield hit the lowest level since 2016 — negative 10 basis points.  And the Japanese 10-year yield traded down to negative 5 basis points today (chart below).  


Now, as you can see, the 10-year in Japan has been back in negative yield territory all year — and sustainably, for the first time since 2016.

The last time rates were down here, the BOJ added some wrinkles in their QE plan.  Instead of targeting a size of asset purchases, they began targeting a zero yield on the Japanese government bond.  So, as long as the yield is positive in Japan, the Bank of Japan has the mandate to buy unlimited assets (print unlimited yen) to push the yield back to zero.  They already own half of the JGB market.  So, how can they influence yields higher from here?  They can sell JGB’s.  What might they do with those proceeds?  Buy global stocks?

If you haven’t signed up for my Billionaire’s Portfolio, don’t delay … we’ve just had another big exit in our portfolio, and we’ve replaced it with the favorite stock of the most revered investor in corporate America — it’s a stock with double potential.

Join now and get your risk free access by signing up here.

May 14, 5:00 pm EST

Yesterday we looked at the big technical support level for the Dow — the 200-day moving average.

That level held beautifully, and stocks bounced aggressively today.

Here’s a look at that chart now ….


With stocks bouncing after a quick 5% correction, we also have a big technical area of support holding in the interest rate market.  As you can see in this next chart, the 10-year yield is holding this big trendline into 2.40%.

So, we have a stronger dollar today, strong commodities prices, higher global stocks and higher rates.  What’s different today, relative to yesterday?  Nothing.

We have a market underpinned by better than expected economic data and earnings. And (different than December) we have a Fed that is in a relatively accommodative stand, promising to do nothing to disrupt the trajectory of the economy and stock market.  That makes stocks a buy on dips.

May 13, 5:00 pm EST

As we discussed last week, the Chinese government will use the yuan to counterpunch tariffs.

They’ve now weakened the yuan by 3% since last month.

If China were to move the currency back to it’s pre-managed float levels (i.e. the peg, which stood at 8.27 against the dollar from the late 90s through 2005), that would be about a 20% devaluation in the yuan (to offset a 25% tariff).

.


That’s unlikely.  It would set off a response from more of the trading partner universe (which has been quiet, and happy to let the U.S. do the fighting for them).  Will the Chinese government move it back above 7 (maybe mid 7s) yuan to the dollar? Likely.

And with that dynamic at work, and an outlook of a worsening economy, the Chinese people will use any means possible to get money out of China.

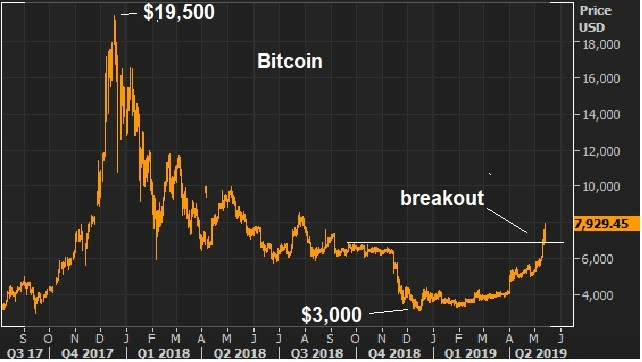
Remember, China forbids it’s citizens to move more than $50,000 out of the country per year.  The rich have gotten around that in the past through buying expensive foreign real estate, creative foreign investments, invoice schemes, even forcing employees to transfer money for them to foreign bank accounts.  But in 2017, China cracked down on the capital flow exodus.  And as we discussed last week, the Chinese then discovered Bitcoin.  The value skyrocketed from $1k to over $19k.  China cryptocurrency exchanges were said to account for 90% of global bitcoin trading.

But in late 2017, the Chinese government cracked down on Bitcoin — banning cryptocurrency exhanges. That set off the crash, from $19k to $3k.

Owning and buying Bitcoin in China is not banned – though it is more difficult now.  But we may now be seeing the effect of the Bitcoin futures market and off-exchange (peer-to-peer) trading as liquidity sources for Chinese citizens to respond to potential devaluation in the yuan.  Bitcoin is on the move, big-time — up 25% since Friday afternoon!

Here’s a look at that chart today …

What about stocks?  Stocks have now fallen over 5% from the highs.  That’s leaves the S&P 500 still up 13% year-to-date.  The Dow is up 9%.  Importantly, today we ran into a big technical level on the Dow– the 200-day moving average.  That level marks a 5.5% decline from the highs of the year in the Dow.  This is a level to buy, not sell. 

If you haven’t signed up for my Billionaire’s Portfolio, don’t delay … we’ve just had another big exit in our portfolio, and we’ve replaced it with the favorite stock of the most revered investor in corporate America — it’s a stock with double potential.

Join now and get your risk free access by signing up here.

May 10, 5:00 pm EST

We end the week with continued stalemate on a trade deal.  Given that trade talks will continue (despite the tariff escalation), it’s not considered a “no deal.”  That’s a relative positive for markets.

As we discussed, as long as Trump will keep the door open, the Chinese will keep talking, and will (in the meantime) protect their exports by weakening the currency.  The yuan is now trading at its weakest level since early January, when trade talks were re-opened after a month long stalemate.

Now, let’s talk about the Uber IPO today …

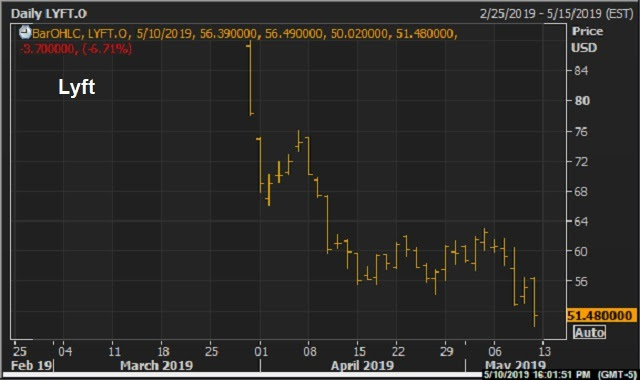
It didn’t go well for Silicon Valley.  Uber started trading publicly below the range they expected, and instead of getting a huge opening day “lyft”, it traded down on the day.

We’ve talked quite a bit about the IPOs coming from the Silicon Valley hype machine.  Lyft got it all started, and here’s what that chart looks like now…


With this above chart in mind and the performance of Uber today, let’s revisit an excerpt from my note from last month …

Pro Perspectives – April 16, 2019

Lyft and Uber, dumping shares on the public at a combined $140 billion plus valuation, may mark the end to the Silicon Valley boom cycle.

As we know, Lyft was valued as high as $25 billion when it started trading publicly.  Some paid a $25 billion valuation for the privilege of owning a company that did a little over $2 billion in revenue, while losing almost a billion dollars — with slowing revenue growth and widening losses. It has now shed about $9 billion in market cap in thirteen days.

Uber is on deck.  Uber filed its S-1 this week.  In this public disclosure document, we find a company that has privately raised $24 billion, valued at $68 billion in the private market, that has been thought to float shares at as much as $120 billion valuation.  This is a company that (like Lyft) also with slowing revenue growth and widening losses.  Losses?  The S-1 shows a swing from $ 4 billion loss in 2017, to a near $1 billion profit in 2018.  But if we back out the a couple of unusual items (like the gain of a divestiture of some foreign businesses and an unrealized gain in an “investment”) the company lost $4.2 billion on $11 billion in revenue.

As we discussed last month, the hyper-growth valuations on these perceived hyper-growth companies, are unlikely to get hyper-growth at this stage.  That will be a problem for those taking the bait on the IPO.”

If you haven’t signed up for my Billionaire’s Portfolio, don’t delay … we’ve just had another big exit in our portfolio, and we’ve replaced it with the favorite stock of the most revered investor in corporate America — it’s a stock with double potential.

Join now and get your risk free access by signing up here.