We've talked in recent days about the end of globally coordinated easy money policies.
The Fed triggered it all in December, when they laid out a timeline for the end of QE. The next day, the Bank of England surprised the world, with a rate hike.
And today they raised again, another quarter point, with four of the nine voting committee members wanting a 50-basis point hike.
Then the European Central Bank followed. They did nothing today, but in a flip-flop from just months ago, Lagarde signaled a rate hike could come this year.
So, over the past couple of months, we've talked about what to expect when the reality of inflation-fighting central banks sets in. A rising interest rate environment is good for value stocks, but bad news for the high growth, high multiple tech stocks (i.e. it's "re-rating" time).
We've seen it early this month in the aggressive selling of small cap, no eps tech stocks. Today we're seeing it one of the most widely held stocks in the world, Facebook.
Facebook was trading north of 25 times earnings before Jay Powell's pivot on the inflation outlook late last summer. Today, it's closer to 17 times earnings.
And this is within the context of a broader market (the S&P 500) that was trading close to 30 times trailing-twelve-month earnings last summer. Now it's 26 times (19 times forward twelve-month estimated earnings).
As we know the Fed is due to end its QE program in March, and begin the liftoff in rates.
Let's take a look back at the many iterations of QE, and the subsequent ending points, following the depths of the financial crisis.
What impact did these events have on market interest rates (i.e. yields)?
The idea behind QE is that the Fed's involvement in the Treasury market puts downward pressure on yields. Lower yields stimulate economic activity through more affordable credit, and forced investment into higher returning (higher risk) assets (among other effects).
As you can see in the chart, QE1, QE2 and QE3 had mixed results. If anything, it could be argued that it created the opposite result in the interest rate market (yields went up, not down). Of course, it can then be argued that the stimulative effect of the Fed's bond purchases improves the economic outlook, and therefore yields go higher.
But you'll also note, from the chart, when QE ended, yields generally went lower.
Now, moving along to the right side of the chart, you can see that this pandemic round of QE pushed yields up (not down).
With all of the above in mind, will the end of QE next month send yields lower?
Unlikely.
A key difference this time? Inflation and growth are clearly better. But maybe more important, other global central banks will be following the Fed to the QE exit door (and following into a subsequent tightening cycle). For much of the post financial crisis environment, as the Fed was ultimately able to exit QE and start lifting rates, deflationary forces continued in Europe and Japan. With that, the emergency policies continued there, and became a heavy anchor for global interest rates.
As we discussed last month, when the Fed laid out a timeline for the end of QE and a potential liftoff in rates, it signaled the end of globally coordinated easy money policies.
A day after that December Fed meeting the Bank of England raised rates for the first time since the pandemic.
The Reserve Bank of Australia ended its QE program today, and set expectations for a potential rate hike this year.
The European Central Bank meets on Thursday. It has dismissed the idea of rate hikes this year, but the market is pricing in two.
Even the Bank of Japan, which has been dealing with three decades of broad deflation, and has had interest rates near zero for nearly a quarter of a century, is debating a post-pandemic rate hike.
This, all because the central bankers know they are way behind. Europe, the UK, Canada, and the U.S. are starting from near zero rates, and they will be chasing inflation that is running around 5% or higher.
The global inflation fight is here and is in the very, very early stages.
The good news: Thus far, central bankers have done a good job managing inflation expectations. If inflation expectations were to become unhinged, the central banks would have a far bigger battle to fight.
Stocks have recovered sharply from the lows of last week. The S&P 500 and the Dow have now closed back above their respective 200-day moving averages.
As we discussed on Friday, corrections are part of investing. And despite all of the things to worry about, this looks like a garden variety correction.
After all, the economy remains on a path to do above trend growth this year, with a very hot jobs market (where employees are commanding higher wages). Consumer and company balance sheets remain strong. And the tailwinds of $6 trillion of new money supply created in the past two years continue to blow.
With this, despite the hand wringing over the Fed, even assuming a more aggressive tightening path than has been projected by the Fed, they will continue to run highly stimulative monetary policy for quite some time (given the position they are starting from — zero rates).
This is all a formula for the continued march higher in asset prices.
But the bond market is behaving strangely. Spreads between shorter dated Treasuries and longer dated Treasuries have been narrowing. That can be a sign of concern about economic slowdown, possibly recession.
Let's take a look …
The chart below shows the yield on the 10-year minus the 2-year. When that goes negative (inverts), it has predicted the last seven recessions (the shaded bars).
As you can see on the chart, to the far right, the 10s-2s spread has been narrowing. Again, this has people asking if something bigger is coming. There's chatter about "slowing growth." But slowing from the best growth in almost four decades, to something still above long-term trend growth (based on forecasts), is still strong growth.
So why is the bond market behaving in a strange way? It's simple. The Fed is still buying bonds until March (they remain in control).
As we end the week, let's step back and get some perspective on stock market declines.
What a difference a month makes. In just thirteen days, the broad stock market (the S&P 500) has declined (peak to trough) 12% from record highs. This is technical correction territory.
Corrections are part of investing. The broad U.S. stock market does, over the long run, go UP. But it's not in a straight line. There are dips along the way.
Since 1946, the S&P 500 has had a 10% decline about once a year. And a 5% dip a couple of times a year, on average.
With this in mind, we often hear interviews of money managers during periods like this, and the question is asked "are you getting defensive?"
That's the exact opposite of what they should be asking. When stocks are up 15-20%, and acknowledging that the long-run average return for stocks is 8%, that's the time to play Defense. When stocks are down 15-20%, that's the time to play Offense.
The reality is most investors should see declines in the U.S. stock market as an exciting opportunity. The best investors in the world do. The same can be said for average investors.
Here's why: Most average investors in stocks are NOT leveraged. And with that, they should have no concern about stock market declines, other than saying to themselves, “what a gift,” and asking themselves these questions: “Do I have cash I can put to work at these cheaper prices?" And, "where should I put that cash to work?”
On that note, we put cash to work in our Billionaire's Portfolio today. If you're not a member and would like to join us, and get all of the details, you can do so here.
We entered the year with an outlook for the Fed to become “inflation fighters” for the first time in a long time. It didn’t take long, with the turn of the calendar for the regime shift (from easy money to tighter money) to become evident in markets.
This has translated into a deflation of the “companies of the future” bubble.
And for those spots, particularly the no earnings companies, the air continues to come out. The portfolio managers with long-term 30-year visions for these companies, are finding out that the term of their vision doesn’t match the term of the capital they are managing (i.e. redemptions).
With that, we see constant selling pressure in the small cap indices, since the start of the year, that looks consistent with forced liquidations. In these cases of forced liquidation, investors tend to sell what they can, not what they want to. And that can carry over to other segments and asset classes in markets.
In these environments, there will be the “baby thrown out with the bath water” situations. It presents an opportunity to buy quality, cash flowing companies at a discount.
They had already guided to an end of QE by March. And given that Jay Powell told us back in December that they wouldn’t start the liftoff on rates until they concluded their bond buying program, we could deduce that March could be the earliest they would move on rates.
On that note, the markets in the past month have priced in that scenario (a March hike). Powell confirmed that today. The other piece of the “tightening” plan, shrinking the balance sheet, has been telegraphed to come in the summer. Nothing was said today to change that course (probably June).
So, if no surprises, why the violent reaction in markets?
The Fed has a good record of managing stability through manipulating expectations on the policy path. On the latter, Powell was sloppy in his press conference (maybe on purpose). He created a gap between what the Fed has been guiding and what he expressed (in words) as a reality.
Keep in mind, the Fed continues to fuel the inflation pain through QE and zero rates, until March. Yet, Powell expressed how inflation was hurting people’s ability to afford basic needs. And he said it has gotten “slightly worse.” Add to that, he said that affordability will become more painful, as fiscal is no longer stimulative and price pressures from supply chain constraints will persist — into next year (according to Powell).
Is he setting us up for a more aggressive path? He should be. Remember, unlike the “taper tantrum” of 2013, the policy error this time isn’t removing emergency policies prematurely. It’s a Fed that has been/is too late.
Last week, we talked about the unwinding of some bubbly assets.
It got uglier today. And then it got better.
Let’s talk about what’s going on …
Remember, we have over 40% growth in money supply in less than two years. That’s a lot of excess money in an economy, chasing a relatively stable quantity of assets. When this happens, you get inflation, and you get irrationally allocated money. This can tend to result in money over flowing good assets, and being pushed to lower quality assets.
Much like the dotcom bubble, and the housing bubble, we again have seen this dynamic of irrational investment. The time of reckoning is here. In this case, it was the overly aggressive Fed and Government response to the pandemic that created the liquidity deluge, and the resulting excessive investment. And now it’s the ‘change in direction’ of those policies that is ending it.
The prospective path of rising interest rates, is already putting downward pressure on valuations. With that, some selling can quickly turn into more selling, which can turn into forced selling.
We’ve talked over the past two weeks about forced selling of overvalued, under-earning tech companies in the famed ARKK Funds. That was the “canary in the coal mine.”
Here’s the good news: After the selling today became broad, markets recovered. And value stocks led the way. This signals that money is not running away from the stock market, it’s simply moving (from overvalued, to undervalued). That’s very positive.
Still, some think the decline in stocks to start the year may influence the Fed’s current path of monetary policy. That’s highly unlikely. Back in 2016 and 2018, a falling stock market caused the Fed to do an about-face on its plans for hiking rates — but the economy was weak and fragile, and inflation was soft.
This time, the Fed is dealing with a 5%+ growth economy, and 7% inflation. They won’t be altering the path. That said, Jay Powell would be smart, in this Wednesday’s post-FOMC press conference, to make it uneventful (i.e. give markets nothing new to chew on).
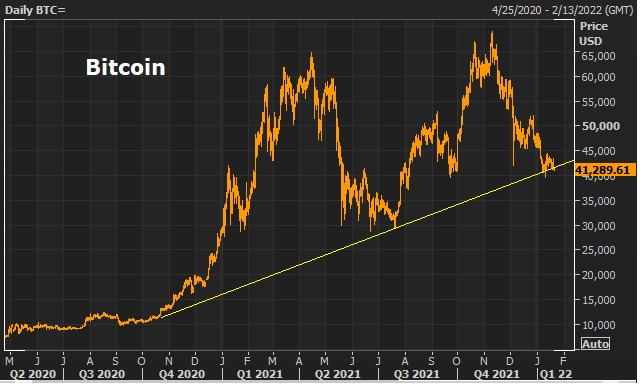
Yesterday we talked about the vulnerability in bitcoin. And we looked at this big trendline.
This line broke today. Bitcoin was down 10%.
As we discussed yesterday, an unraveling of the private crypto bubble would be powerful enough to create some waves in broader markets. And we may have had a catalyst for it, with the Fed’s release of its Central Bank Backed Digital Currency report yesterday (i.e. the CBDC, a potential private digital currency killer).
On a related note, remember we looked at this chart below last week, which shows the relationship between the bets on the “companies of the future” (Cathie Woods’ ARK Funds) and the “money of the future.”
Both ARKK and Bitcoin have been investments that have been based on qualitative theories about the distant future — with valuations driven by the gush of liquidity (monetary and fiscal),rather than fundamentals. The liquidity spigot is now closed, and these trades are being unwound.
It’s probably no coincidence that the top in the Nasdaq (highly valued tech) and the top in Bitcoin came in the second week of November.
That was when it became clear that a change in the direction of both fiscal and monetary policy had arrived. Just over the course of a few days (in November), the Fed’s stated condition for rate liftoff was seemingly met (with a booming job report) and Congress passed the $1.2 trillion infrastructure bill.
This change in direction from easing to tightening is a signal for value stocks to outperform growth, which is underway. And historical studies suggest this value stock outperformance can hold for the next decade. It’s a buy the dip — on value.
The Fed released its report on a digital dollar this afternoon. Stocks had been in rebound mode for much of the day, but went south when the report hit.
The Fed was due to deliver this report, on the viability of a central bank-backed digital currency (CBDC), back in September. It never happened.
And throughout this period, when Jay Powell was being scrutinized for re-nomination, the Fed Chair carefully avoided taking a position on it. His talking point has since been, that it will be a decision made by all stakeholders (namely, Congress). Today’s report said the same.
On that note (a decision for Congress – those in power), we have some clear direction. They want it. And they want to kill private digital currency. Remember, back in June, Elizabeth Warren held a hearing on this. Warren made it clear that a central bank-backed digital dollar would “help drive out bogus digital private money (bitcoin, stablecoins, etc.).“
It’s not only U.S. officials that may be challenging the rise of private money. Just as the “build back better” and clean energy transformation is an agenda highly coordinated by major global economic powers, so is the concept of CBDCs. The BIS (Bank for International Settlements) consists of 63 global central banks, and nearly 90% of them are having conversations about adopting a CBDC.
With the drop of this new report today, Bitcoin swung from a positive day, to close down, and on the lows. And as you can see in the chart above, the future of bitcoin mania may hinge on this big trendline.
Why would stocks get hit on this currency report? Maybe it was just an additional catalyst in a market that has already been unwinding overvalued/bubbly tech stocks. And now we may see an unwinding of a bubble in private crypto.
The former, has been orderly, with money moving from growth to value stocks. The latter may create some waves.
Nonetheless, the technical picture in the big stock indices became considerably uglier by today’s close.
As you can see, the S&P 500 has clearly broken the big trendline from election day, and is testing the 200-day moving average (the purple line).
The support has already given way in the Nasdaq.
This brings us back to the discussion we had yesterday, on the Fed meeting next week. Through the post-financial crisis era, the Fed’s hand was forced, more than once, by instability in stocks. As we discussed yesterday, we should not expect the Fed to react, in this environment.
But, more pain in stocks from here would likely get a fiscal response. We’re already seeing some signs that “Build Back Better” will be carved up and done in pieces. I suspect we would see a deal like that, where the clean energy piece (wish list), was approved. My view: That would be the shock absorber for markets, if needed.