|
|
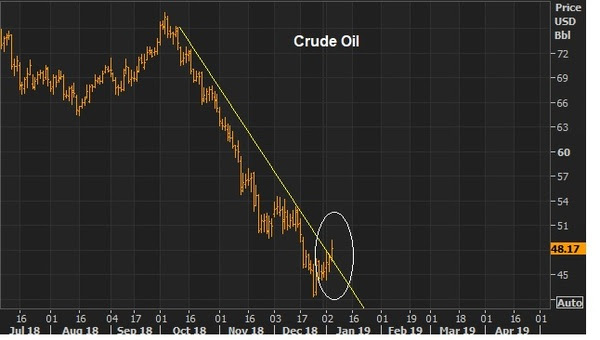
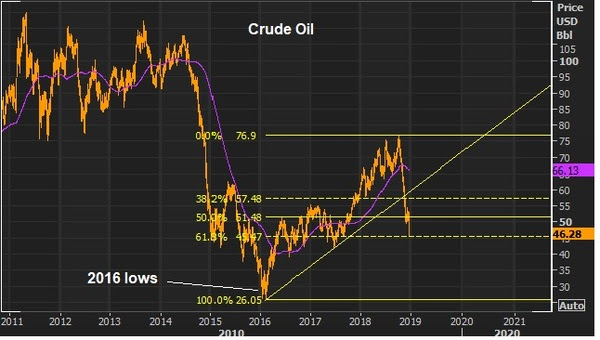
January 9, 5:00 pm EST We discussed yesterday how markets might look by the end of the year, if the pontifications about a global slowdown and impending crisis are dead wrong. The reality: That is the low probability outcome. The higher probability outcome is another 3%+ year growth in the U.S. in 2019, a resolution on the Chinese trade dispute, and a rebound in emerging market growth. With the “high probability scenario” in mind, let’s take a look at some key charts that look very vulnerable to a sharp squeeze. Remember, oil and stocks have been in a synchronized decline since October 3. On Friday we looked at this chart on oil, and the break of the big downtrend that accompanied some rate-hike relief jawboning from the Fed. |
 |
|
Today the chart looks like this …up almost 9% from Friday.
|
 |
|
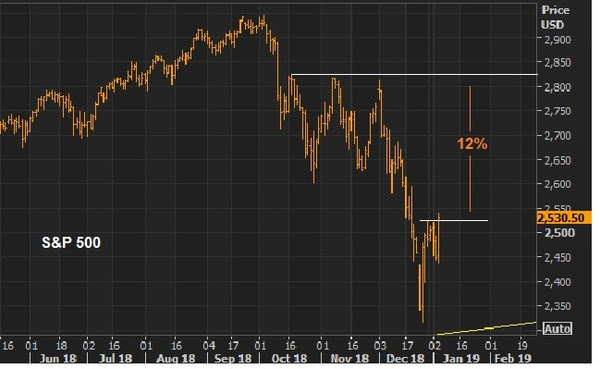
Here’s the chart on stocks we looked at on Friday …
|
 |
|
We broke a big level on Friday at 2,520. We’re up another 2.3% since. What about yields? The fear in the interest rate market hasn’t been/wasn’t that the economy can’t withstand a 3% ten-year yield. The fear has been the speed at which the interest rate market was moving, and the methodical tightening process of the Fed. Would 3% quickly become 4%? The Fed has now backed off. That quells the fears of a “too far, too fast” adjustment in rates. But the interest rate market had already been pricing in the worst case scenario (another recession and crisis, in part thanks to the Fed policy). If that was an over-reaction, I suspect we’ll see a move back toward 3%-3.25% in the 10s in the coming months. As you can see in the chart, this big line is being tested today. And as long as the Fed stays data dependent, not telegraphing another series of hikes, the market should accept a 3% ten year yield just fine. |
 |
|
To sum up: Markets tend to be caught wrong-footed at the extremes — leaning too hard in one direction, with sentiment too depressed or too exuberant. And I suspect we’ve seen that extreme in Q4. Sentiment was deeply shaken by the sharp decline in stocks, and that spilled over into the outlook for global economic stability.
But as we discussed yesterday, we have a Q4 earnings season upon us that is set up for positive surprises (given the sharp downward adjustment in expectations). And if Trump gives some ground to get a deal done with China, these key markets are set up for big and sharp recoveries. Join me here to get my curated portfolio of 20 stocks that I think can do multiples of what broader stocks do, coming out of this market correction environment.
|
|
January 3, 5:00 pm EST
As we’ve discussed, the dysfunctional stock market has put pressure on Trump to stand down and make a deal with China.
And Apple’s CEO, Tim Cook, turned up that pressure yesterday. In a letter to investors, he warned that Apple, the biggest and most powerful company in the world, would have lower revenue in the quarter that just ended. The blame was placed on economic deceleration in China —due to the trade dispute.
Now, it’s clear that Cook wanted to draw attention to the impact of the trade dispute. And the media was happy to run with that story today.
But the slowdown at Apple last quarter also had a lot to do with “fewer iPhone upgrades than anticipated.” This was tossed into the context of slower economic activity in China, which makes it look like a macro issue. But Apple also has a micro issue. They seem to have exhausted the compelling innovation that has historically gotten iPhone users excited about buying the latest and greatest phone. The older models are still pretty great. No reason to upgrade.
So, Apple has used a violent market and slowdown in China, perhaps, in an attempt to divert attention away from the slowing device business.
The good news: Even if they don’t develop the next world-changing device, they have a services business (Apple pay, Apple Music, iCloud Drive, AppleCare and the iTunes App store) that is producing almost as much revenue as Facebook.
And the stock is incredibly cheap. On trailing twelve months, the stock trades at 12 times earnings. But if we back out the nearly $240 billion of cash Apple is sitting on, the business at Apple is being valued at $437 billion. That’s about 7 times trailing twelve month earnings.
|
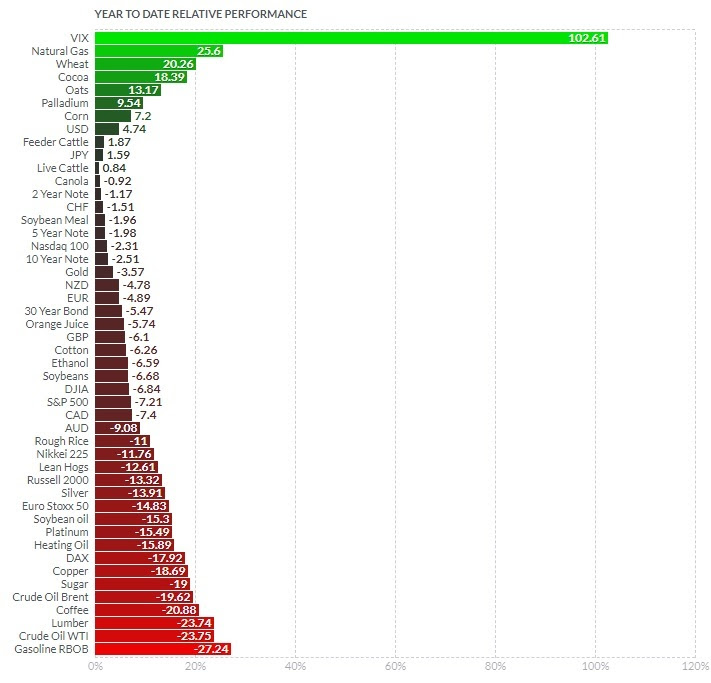
December 21, 5:00 pm EST As we head into the holidays and the end of the year, let’s take a look at the 2018 performance for the world’s biggest asset classes, currencies and commodities. |
 |
|
As you can see, there’s a lot of red. Global stocks are down. Bonds are down. Major commodities, down. Gold, down. Foreign currencies, down. Now, as we’ve discussed, major moves in markets are often triggered by a very specific catalyst, and then prices tend to drive sentiment change, and sentiment then tends to exacerbate the move in markets. There are always plenty of stories, at any given time, that can sound like rational explanations to fit to the price. In the case of the declines across asset classes this year, we’ve heard many viewpoints from very smart and accomplished investors over the past week, with concerns about the Fed, debt, deficits, slowdown, the end of an expansionary cycle, etc. With all of this said, often times the driver behind these moves in markets is specific capital flows (forced liquidations), not an economic narrative. With that, in rear view mirror, a lot of times (historically) all of the pontifications surrounding markets like these end up looking very silly. For example, let’s take a look at the run-up in oil prices back in 2007-08. Oil prices ran from $50 to almost $150 in about 18 months. Everyone was telling the world was running out of oil — “peak oil.” Did everyone get supply and demand so wrong that the market was adjust with a three-fold move that quickly? The reality: the price of oil was being driven by nefarious activities (manipulation). A major oil distributor was betting massively on lower oil prices and ran out of cash to meet margin requirements, as they were consequently squeezed (forced to liquidate) by predatorial traders that pushed the market higher. Among the predatorial traders, the largest oil trading company in the world, Vitol, was found to have been essentially controlling the oil futures market. When the CFTC (the regulators) finally came knocking to investigate, that was the top in oil prices. In the case of recent declines, the catalyst looks to be geopolitical (not economic), which then has given way to an erosion in sentiment (which can become self-fulfilling). The geopolitics: We’ve talked about the timeline of the top in stocks back in January, and how it aligns perfectly with the release of very wealthy Saudi royal family members and government officials, after being detained by the Crown Prince for three months on corruption charges. And then the decline from the top on October 3rd (both stocks and oil prices) aligns, to the hour, with the news that the Crown Prince would be implicated in the Khashoggi murder. These two events look like clear forced liquidations by the Saudis to retrieve assets invested in U.S. (and global) markets (assets that are vulnerable to asset seizures or sanctions). Beyond this selling, we also have a party that might have an interest in seeing the U.S. stock market lower: China. Trump has backed them into a corner with demands they can’t possibly fully agree to. If they did, their economy would suffer dramatically, and the ruling party would be highly exposed to an uprising. Could China be behind the persistence in the selling. Quite possibly. Bottom line: The lower stock market has put pressure on the Trump agenda, which makes it more likely that concessions will be made on China demands. My bet is that a deal on China would unleash a massive global financial market rally for 2019, and lead to a big upside surprise in global economic growth. Join me here to get my curated portfolio of 20 stocks that I think can do multiples of what broader stocks do, coming out of this market correction environment.
|
|
December 14, 5:00 pm EST
We’ve talked about the struggling Chinese economy this week.
As I’ve said, much of the key economic data in China is running at or worse than 2009 levels (the depths of the global economic crisis).
And the data overnight confirmed the trajectory: lower.
As we’ve discussed, this lack of bounce in the Chinese economy (relative to a U.S. economy that is growing at better than 3%) has everything to do with Trump squeezing China.
He acknowledged it today in a tweet ….
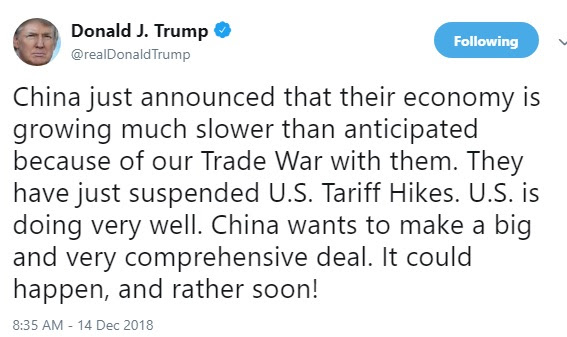
The question: Has China retaliated with more than just tit-for-tats on trade? Have they been the hammer on U.S. stocks? It’s one of the few, if not only, ways to squeeze Trump. As we discussed last week, when the futures markets re-opened (at 6pm) on the day of mourning for the former 41st President, there was a clear seller that came in, in a very illiquid period, with an obvious motive to whack the market. It worked. Stocks were down 2% in 2 minutes. The CME (Chicago Mercantile Exhange) had to halt trading in the S&P futures to avert a market crash at six o’clock at night.
Now, cleary stocks have a significant influence on confidence. You can see confidence wane, by the day, as stocks move lower. And, importantly, confidence fuels the decisions to spend, hire and invest. So stock market performance feeds the economy, just as the economy feeds stock market performance. The biggest threat to a fundamentally strong economy, is a persistently unstable stock market. In addition, sustaining 3% growth in the U.S. will be difficult if the rest of the world isn’t participating in prosperity.
With that in mind, in my December 1 note, I said “it may be time for Trump to get a deal done (with China) and solidify the economic momentum needed to get him to a second term, where he may then readdress the more difficult structural issues with China/U.S. relations.” That seems even more reasonable now.
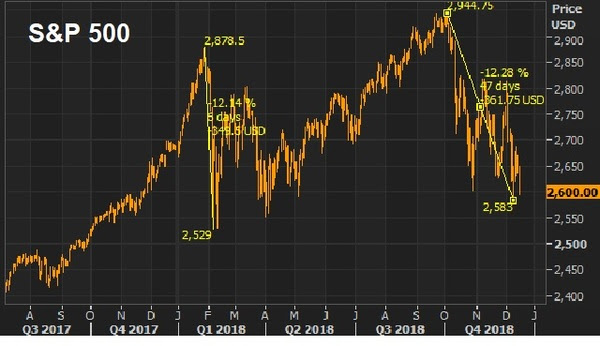
We have two 12% declines in stocks this year. And you can see the fear beginning to set in. With that, the best investors in the world have made their careers by “being greedy when others are fearful” (Warren Buffett) or “buying when most people are selling and selling when most people are buying” (Howard Marks). There is clear value in stocks right now.
|
December 11, 5:00 pm EST We’ve talked about the market volatility the past few days. Let’s take a look at a chart of the many swings in stocks for the year. |
|
|
 |
|
You can see we’ve had seven significant declines this year. A clear observation in this chart is that the declines are fast. As they say, the market goes up on an escalator and down in an elevator. We’ve had a 12% decline over six days. A 5% decline in three days. A 9% decline in thirteen days. An 8% decline in six days (to open October). A 7.8% decline in eight days. A 6.8% decline in ten days. And, this recent, 8.2% decline in five days (assuming yesterday was the bottom). So, the seven declines of the year have averaged 8%, over a period of seven days. This argues that we probably have, indeed, seen the low on this recent sharp slide. And that leaves us, at today’s close, with a stock market trading at 15 times earnings — among the cheapest valuation we’ve seen only two times in the past 26 years. What stocks do you buy? Join me here to get my curated portfolio of 20 stocks that I think can do multiples of what broader stocks do, coming out of this market correction environment. |
December 10, 5:00 pm EST
On Friday we talked about the rise in market volatility, and what’s driving it.
It’s regime change. For the better part of a decade we had an economy driven by monetary stimulus (and loads of central bank intervention to absorb any potential shocks to markets). And since the election, we now have an economy driven by fiscal stimulus and structural reform.
But as I said Friday, with dramatic change, the pendulum can often swing a little too far in the opposite direction at first (from little-to-no volatility to a lot, in this case).
As it stands, stocks are now down about 1% on the year. In normal times you would see other alternative asset classes (to stocks) performing well. Bonds would be the obvious winner — but if you owned 10-year notes you would be down about 3% on the year (about flat after the yield). When stocks are down, and uncertainty is rising, gold tends to do well. Not this year. Gold is down 4.5% on the year. What about real estate. The Dow Jones Real Estate index is up, but small (+1.8%). Among the best investments of the year is cash. If you owned 1-month T-bills all year, you would be up close to 2%. I suspect this dynamic of little-to-no return asset class alternatives will change very soon.
|

