|
|
|
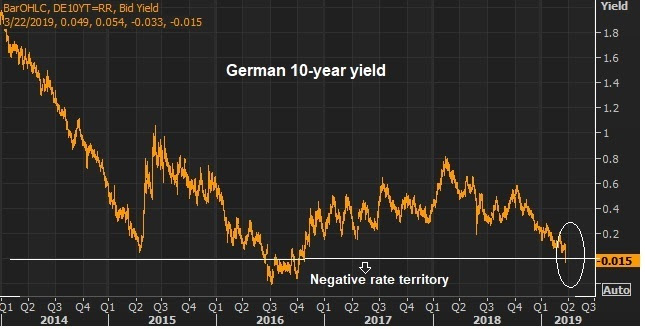
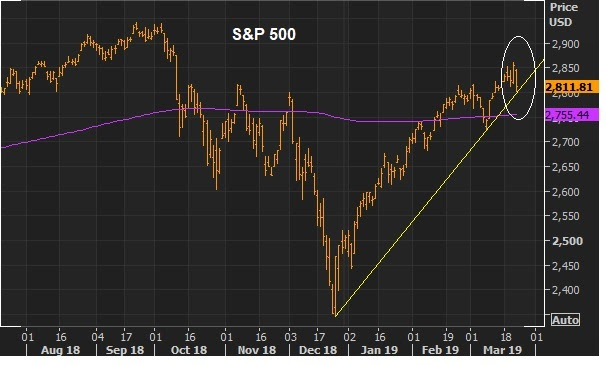
March 27, 5:00 pm EST We’ve talked this week about the yield curve inversion. In response, the market is now pricing in a better than 70% chance of a rate cut in June. And Trump’s new pick to join the Fed, Stephen Moore, has said the Fed should cut by 50 basis points immediately.We’ve talked about the comparisons between 2019 and 1995. In 1994 the Fed aggressively tightened into a low inflation, recovering economy (as they did in 2018). By the middle of 1995, they were cutting. Stocks finished the year up 36%. Given the contrast of where the Fed has positioned themselves now, compared to just three months ago, they have effectively eased — and we can see it clearly manifested in the interest rate market. The 10-year U.S. government bond yield has gone from 3.25% to under 2.5% since just November. I would argue we already have a repeat of 1995. Here’s a look, in the chart on the left, at what stocks did in 1994-1995, when the Fed transitioned from
|
 |
|
Within a few quarters of the ’95 rate cut, U.S. growth was printing above 4% and did so for 18 consecutive quarters. Stocks tripled over that period. Join me here to get my curated portfolio of 20 stocks that I think can do multiples of what broader stocks do, through the end of the year. |
|
March 25, 5:00 pm EST
There was a big technical break in the interest rate market on Friday. And the yield curve inverted.
What does it mean, and should we be concerned?
First, when people talk about the yield curve, they are typically talking about the yield on the 3-month Treasury bill versus the yield on the 10-year government bond. The latter should pay more, with the idea that money will cost more in the future (compensating for inflation and an “uncertainty about the future” premium).
When the 10-year is paying you less than you could earn holding a short term T-bill, the yield curve is said to be inverted. And this dynamic has predicted the past seven recessions. Why? Because it typically will be driven by a tighter credit environment, namely banks become less enthused about borrowing in the form of short term loans, to lend that money out in longer term loans. Money dries up. Unemployment goes up. Demand dries up. Economy dips.
With this in mind, today the 3-month treasury bill pays 2.44%. And the 10-year government bond pays 2.41%. The spread is negative which makes for an inverted yield curve.
Now, while an inverted yield curve has preceded recessions with a good record, we’ve also had inverted yield curves and no recession has followed.
What isn’t talked about much, is why the yield curve is inverting this time. It sort of spoils the drama to talk about the “why”. Unlike any other time in history, we have an interest market that has been explicitly manipulated by global central banks for the past decade (via global QE). And we have one major central bank (the Bank of Japan) remaining as a buyer of unlimited global assets (that includes U.S. 10 years, which pushes the 10-year yield lower).
Remember, the Bank of Japan’s policy of targeting their 10-year government bond yield at zero, means they will be a buyer of unlimited bonds to push JGB yields back toward zero (price goes up, yields go down). And when the tide of global rates is rising, pulling UP their yields, they will be a buyer of whatever they need to, to push things back down (and they’ve done just that).
What does that mean? It means, as the Fed has been walking its short-term benchmark rate higher, the “long-end” of the interest rate market (the 10-year yield) has been anchored by central bank buying – buying by all major central banks for the better part of a decade, and now led by the BOJ. That has kept a lid on the U.S. 10-year government bond yield, and global government bond yields in general.
|
|
March 21, 5:00 pm EST Stocks came back strong today as the market has had a little more time to digest what the Fed signaled yesterday. As we discussed yesterday, the Fed has effectively eased monetary policy since the December stock market rout, by slamming the breaks on their “rate normalization” plan. They’ve gone to great lengths to communicate to markets that they willnot kill the economic recovery. Moreover, they’ve told us that they will do whatever it takes to keep the economc recovery going. Now, let’s talk about the signal they gave in the economic projections they released yesterday. They dialed down what they call their “terminal” or “neutral rate.” In the long run, this is benchmark interest rate that they believe is neither contractionary nor expansionary for the economy. When the Fed started the rate normalization process, they thought the terminal rate was 3.5%. Now they think its 2.78%. Does this imply they think the economy is in a new normal of lower growth and lower inflation? Probably not. First, the Fed has had an abysmal record of predicting rates, inflation and growth in the post-crisis era. Throughout, they have been way overly optimistic. And as markets have taken cues from the Fed, their bad predictions have bitten them. Arguably, they mis-set expectations and that led to negative surprises, which ultimately forced the Fed to keep emergency level policies maybe lower and longer than what would have been necessary had they guided expectations better. Jeff Gundlach, one of the world’s best bond fund managers, made this comment today regarding the Fed’s forecasts …
|
 |
|
I agree. But if we look at the forecasts the Fed published yesterday, I suspect there may be a new motivation for these projections. Instead of using this document as a way for Fed members to pontificate on the future of the economy, I think they are using it as a way to manage down expectations, just as a company sets a low bar on earnings expectations — so that they can beat them.
Maybe a lesson learned from the mistakes of the past 10 years — set the expectations bar too low, not too high.
Join me here to get my curated portfolio of 20 stocks that I think can do multiples of what broader stocks do, coming out of this market correction environment.
|
|
|
|


