August 17, 5:00 pm EST
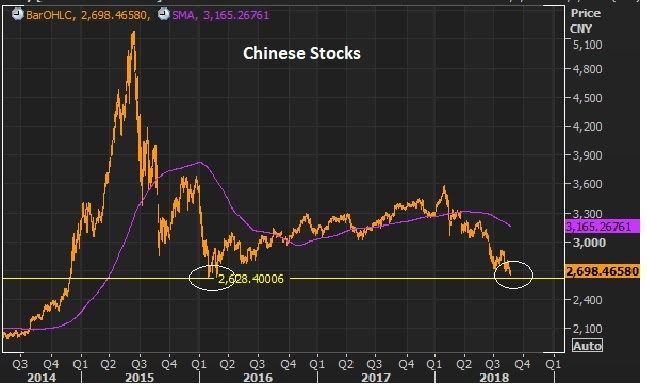
Back in July, we talked about the significance of the President of the European Commission coming to Washington to make a deal on trade. That was a big day for Trump’s fight to level the playing field on global trade.
Why? Because concessions out of Europe paved the way to more concessions globally.
That’s what we’re getting. Fast forward a little less than a month and now we have China (the center of the global trade dispute universe) coming back to the table on trade negotiations with the U.S.
This is what happens when you negotiate from a position of strength. Trump has the leverage of a strong economy, and the credibility to act on tough threats. And that is bringing about progress. Trading partners risk being left behind in the global economic recovery if they don’t play ball.
So we should expect “movement” from China. And movement equals success.
With that, as I said, I suspect that will be the catalyst to get stocks back on the path toward double-digit gains by year-end.
July 30, 5:00 pm EST
The Nasdaq continued to slide today. Stock indices tend to go down a lot faster than they go up. The tech giant-driven Nasdaq was up over 15% year-to-date, just a few days ago, and has now given up more than 4% from the highs.
Not surprisingly, as people run for the exit doors on the big tech giants (taking profits), we’re seeing money rotate into the blue-chip value stocks.
The Dow and S&P 500 did much better than the Nasdaq today, which continues to slowly correct the big performance gap of the year (where the Nasdaq was up 15% at one point, while the DJIA was flat on the year).
Now, the biggest event of the week for markets may take place tonight. We hear from the Bank of Japan on monetary policy. We’ve discussed, many times, the role that Japan continues to play in our interest rate market.
Despite seven hikes by the Fed from the zero-interest-rate-era, our 10-year yield has barely budged. That’s, in large part, thanks to the Bank of Japan. Japan’s policy on pegging its 10-year yield at ZERO has been the anchor on global interest rates.
As I’ve said, when they finally signal a change to that policy, that’s when (our) rates will finally move. And that may be tonight. There is speculation that they may adjust UP that target on their 10-year yield. That would represent a dialing back of the BOJ’s QE program, which would signal the initial steps of exiting the crisis-era QE program.
What would that do? If the BOJ does indeed adjust their “yield curve control” policy, it should send global interest rates higher. That would put our ten-year yields back above 3%, which has been a level that has caused some uneasiness in markets. This time around, a move back above three percent would reflect a steepening U.S. yield curve which may be perceived as a positive, especially for those that have been concerned about the potential of seeing an inverted yield curve (i.e. a recession indicator).
If you haven’t joined the Billionaire’s Portfolio, where you can look over my shoulder and follow my hand selected 20-stock portfolio of the best billionaire owned and influenced stocks, you can join me here.
July 27, 5:00 pm EST
As we end the week, let’s take a look at a few charts ….
We had the first look at Q2 GDP today. Here’s an updated look at the chart of the average four-quarter annualized growth rate we looked at
yesterday ….
 This number will be formally revised two more times, but the “advance” number came in at 4.1%. Yesterday we talked about the prospects for the highest four-quarter annualized growth rate since 2006. We just missed it, in this first reading. But the Q1 number was revised UP to 2.2%, so adding in today’s Q2 number, and we get 3.1% four-quarter average annualized growth. Only for a moment, in 2010, was it better (at 3.15%).
I suspect we will see a bigger number in the coming Q2 revisions. And if sentiment on trade indeed bottomed out on Wednesday, with the EU concessions, we will likely have a big Q3 growth number coming.
That steadily rising trend, since the election, in the four-quarter average growth rate is a big deal. With that, I would call the above chart, the most important chart of the week…
Let’s look at the second most important chart of the week ….
 I’ve been making the case that the massive Nasdaq outperformance, relative to the Dow, would begin correcting. In the chart above, you can see that it’s starting (Dow moving up, Nasdaq moving down). And it’s being led by strength in the blue chips following strong Q2 earnings, and weakness in two of the big tech giants (Netflix and Facebook) following big misses. With that, Facebook has quickly revisited levels of early May (which should give us all perspective on how aggressive this run in the tech giants has been over the past two months).
The question: Is it “peak Zuck?”

If you haven’t joined the Billionaire’s Portfolio, where you can look over my shoulder and follow my hand selected 20-stock portfolio of the best billionaire owned and influenced stocks, you can join me here.


