January 11, 2022

Stocks continued the big bounce today into technical support. 

Let’s take an updated look at the S&P 500 chart …

So, we had a 5.5% decline in this benchmark index to start the year, and now we have a sharp bounce of nearly 3% from this big technical trendline, which comes in from the election day lows of November 2020 (an important marker).

We heard from Jay Powell today, in his renomination hearings before the Senate.  He did nothing to change the expectations on the Fed’s guidance on the rate path.  Whether it be three or four hikes this year, we’ve just finished a year with around 10% nominal growth and over 5% inflation.  

The coming year may be more of the same, and yet we have a market and Fed posturing and speculating over how close to 1% the Fed Funds rate might be by year end.  That dynamic only adds fuel to the inflation and growth fire.  

On that note, we’ve been watching three key spots that should be on the move with this policy outlook:  bonds (down), gold (up) and the dollar (down). 

Gold was up 1.25% today, making another run at this 1830-50 level.  If that level gives way, the move in gold should accelerate.  As you can see in the chart, we would get a breakout from this big corrective trend that comes down from the August 2020 all-time highs.     

On a related note (dollar down, commodities up), the dollar looks vulnerable to a breakdown technically …


We kick off fourth quarter earnings this week.  We’ll hear from the big banks on Friday: JP Morgan, Citi and Wells Fargo.  

Bank of America and Goldman Sachs earnings will come early next week.

Last year, across the broad market, the table was set for positive earnings surprises, against a backdrop of deliberately dialed down expectations.  And those low expectations were against a low base of 2020, pandemic/lockdown numbers.  

With that, we’ve had positive earnings surprises throughout the first three quarters of 2021.  The expectation is for 21% earnings growth for Q4, which would give us four consecutive quarters of 20%+ earnings growth and 40% earnings growth on the year.  

That said, of the nearly 100 S&P 500 companies that have issued guidance for Q4, 60% are negative.  That’s straight from the corporate America playbook: Using the cover of the Omicron news from late November to lower expectations, to position themselves to manufacture positive earning surprises OR withhold some earnings power for next quarter. 

So, in addition to the changing interest rate cycle, could the slide in stocks to open the year have something to do with weaker Q4 earnings?  Maybe. 

On that note, let’s take a look at the big technical support hit today …

In the chart above, the S&P 500 hit this big trendline that comes in from election day.  This rise in stocks, of course, has everything to do with an agenda that entailed even more massive fiscal spending programs — AND a central bank that remained in an ultra-easy stance.  

Indeed, we’ve since had another $1.9 trillion spend passed in late January of last year, plus a $1.2 trillion infrastructure package later in 2021.  

Now we have a Fed that has flipped the script, and the additional bazooka agenda-driven fiscal package has been blocked — and we get a test of this big trendline.   

The good news:  The line held today, and stocks bounced aggressively (about 100 S&P points) into the close.  

As you can see in the chart below, we have a similar line in the Nasdaq, dating back to the election.  This breached but closed back above the line today.

With the above in mind, we should expect the banks to continue putting up big numbers to kick off the earnings season later this week.  That will be fuel for stocks.   

Remember, the banks set aside a war chest of loan loss reserves early in the pandemic, and they have been moving those reserves to the bottom line since, at their discretion.  As an example, both Citi and JP Morgan have another $5 billion to release, to bring their loan loss reserves back in line with pre-pandemic levels.  That’s $5 billion (each) that will be turned into earnings.

April 18, 5:00 pm EST

Yesterday we talked about the positive surprises in the Chinese data.  This is important because the global slowdown fears have been centered around the weak Chinese economy.

So, we now have what looks like a bounce off of the bottom in Chinese industrial output and Chinese retail sales (two key indicators of economic health).

Today we had more positive surprises for the global economic outlook picture.  The UK retail sales number came in better than expected.  And the U.S. retail sales came in better.

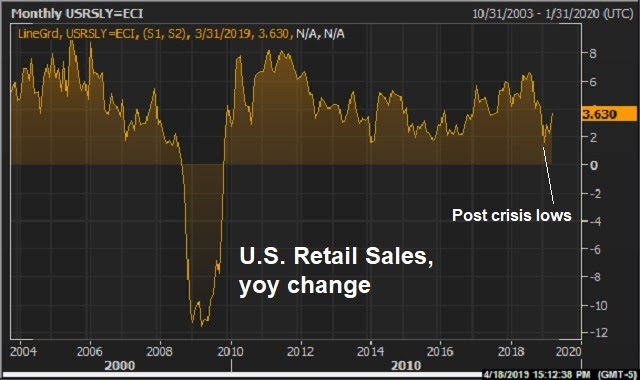
You can see in the chart below, this March U.S. retail sales is a bounce from the post-crisis lows of December.  

With this, the Q1 GDP estimate from the Atlanta Fed has bumped up to 2.8%.

We’ve talked about the set up for both earnings and the economic data to surprise to the upside for Q1, given the dialed down expectations following the December decline in stocks.

You can see how this is playing out in the chart below (see where the gold line is diverging from the “consensus estimate” blue line) …

If you haven’t signed up for my Billionaire’s Portfolio, don’t delay … we’ve just had another big exit in our portfolio, and we’ve replaced it with the favorite stock of the most revered investor in corporate America — it’s a stock with double potential.

Join now and get your risk free access by signing up here.

April 17, 5:00 pm EST

Last month we talked about Chinese stocks has a key spot to watch for: 1) are they doing enough to stimulate the struggling economy, and 2) (more importantly) are they taking serious steps to get to an agreement on trade with the U.S.?

The signal has been good.  Chinese stocks are up 34% since January 4th.

As I said back in March, Chinese stocks are reflecting optimism that a bottom is in for the trade war and for Chinese economic fragility.  That’s a big signal for the global (and U.S.) economy.

Fast forward a month, and we’re starting to see it (the bottoming) in the Chinese data.  Overnight, we had a better than expected GDP report.  And industrial output in China climbed at the hottest rate since 2014.

For those that question the integrity of the Chinese GDP data, many will look at industrial output and retail sales.  Retail sales had a better than expected number too overnight.  And the chart (too) looks like a bottom is in. 

Remember, by the end of last year, much of the economic data in China was running at or worse than 2009 levels (the depths of the global economic crisis).

The signal in stocks turned on the day that the Fed put an end to its rate hiking path AND when the U.S. and China re-opened trade talks (both on January 4th).

April 2, 5:00 pm EST

Oil is one of the biggest movers of the day, now back above $60.

That’s nearly 50% higher from the lows of late December.

Is that surprising?  It shouldn’t be.  Declines in both stocks and oil (late last year) were triggered by threats of sanctions on Saudi Arabia.  We talked about it as it transpired in these daily notes. The stock market decline started on October 3rd when headlines hit that implicated the Saudi Crown Prince in the murder of the journalist, Jamal Khashoggi.  Oil topped the same day, and then accelerated the day Trump spoke with the Saudi Crown Prince on the phone on October 16. Oil opened that day at $72 and hasn’t seen the level since (forty-three days later it was trading at $42).

The Saudi capital flight threat dissolved as it became clear later in the year that the U.S. would sanction Saudi individuals only — and not the Crown Prince, nor the government.  Sill those geopolitical risks early on, soon turned into eroding sentiment — as lower stocks, feed weaker confidence.

But we’ve had a full “V-shaped” recovery in stocks.  And I’ve suspected we would see the same in oil prices. And the catalyst has been a coordinated response from global central banks, not too dissimilar from what we saw in 2016, following another oil prices crash.  Oil and stocks rallied aggressively back then.  And we’re seeing a similar result this time.

Remember, we looked at this chart back in February…


Here is a look at the chart now as crude continues to recover the declines of late last year (working toward completing the “V”)…

Join me here to get my curated portfolio of 20 stocks that I think can do multiples of what broader stocks do, through the end of the year.

April 1, 5:00 pm EST

Last week we talked about the buildup to the Lyft IPO.

Lyft, “lifted” to a valuation of close to $25 billion when shares started trading on Friday.  Today, it’s down as much as 20% from the Friday highs.

The last private investment valued the company at $15.1 billion.  That gave them a paper gain of over 60% on Friday, for just a 9-month holding period. Good for them.

For everyone else, remember, you’re looking at a company that did a little over $2 billion in revenue, while losing almost a billion dollars. Most importantly, over the three years of data that Lyft shared in its S-1 filing, revenue growth has been slowing and losses have been widening.

So, you’re buying a company that hopes to be profitable in seven years, to justify the valuation today.  This is a company that has only existed seven years.  And to think that we can predict what the next seven will look like, in the ever changing technology and political/regulatory environment (much less economic environment), is a stretch.

For some perspective on these valuations, below is what it looks like if we compare the three largest/dominant car rental car companies (Enterprise, Hertz and Avis) to the two largest/dominant ride sharing companies.


With Uber now expected to be valued at around $120 billion when it goes public (possibly this month), the ride sharing industry is valued at about 14 times the car rental industry.

The rental car industry has been priced as if ride-sharing industry has destroyed it.  Ironically, if the ride sharing movement is to succeed in the long-run, and is to fully reach the potential that is being priced into the valuations, then they will need these car rental companies to supply and manage the fleet of vehicles required for Uber and Lyft to scale.

Join me here to get my curated portfolio of 20 stocks that I think can do multiples of what broader stocks do, through the end of the year.

March 20, 5:00 pm EST

The Fed met today and confirmed the signaling we’ve seen since early January.

With the luxury of solid growth, low unemployment and subdued inflation, they have been signaling to markets, since January, that they will do nothing to rock the boat.  That move has restored confidence and stock prices (a reinforcing loop).

So, the Fed has gone from mechanically raising rates (as recently as December) to sitting on their hands.  And today they are forecasting no further rate hikes this year, and they are ending the unwind of their balance sheet in September (ending quantitative tightening).

This all looks like a move to neutral, but given the rate path they had been telegraphing up until the end of last year, this pivot is effectively easing — especially since these moves look like pre-emptive strikes against the potential of Brexit and U.S./China trade negotiations going bad.

With that, we have a big technical break in the bond market today.  The U.S. 10-year government bond yield (chart below) broke this important trendline today.


This trendline represents the “normalization” of market rates following the Trump election.  Following the election, with the optimism surrounding Trumponomics, the market started pricing OUT the slow post-recession economic growth rut, and pricing IN the chance that we could see a return to sustained trend growth.

So, what is it pricing in now?  I would say its pricing in the worst-case scenario – a no deal with China.

Join me here to get my curated portfolio of 20 stocks that I think can do multiples of what broader stocks do, coming out of this market correction environment.

March 19, 5:00 pm EST

We’ve seen the verbal and Twitter shots taken by Trump at the tech giants since he’s been in office.  And the threats have slowly been materializing as policy.

We get this today …


With this in mind, we’ve talked quite a bit about the domestic leveling of the playing field. The tech giants (Facebook, Amazon, Netflix, Google, Twitter …) are on the regulatory path to being held to a similar standard that their “old economy” competitors are held to.  They may have to pay for real estate (i.e. bandwidth). They may be scrutinized more heavily for anti-competitive practices.  And they may be liable for content on their site, regardless of who created it.

The latter was the subject of the Trump tweet today.  And he was asked about it in a press conference.  He said we “have to do something about it.”  He called the discrimination and bias “collusion” from the tech giants.

The regulation is coming. And depending on the degree, at best, it changes the business models of these “disrupters.” At worse, it could destroy them.  Imagine, Facebook and Twitter being held liable for things their customers are saying on their platforms.  That’s endless compliance to ward of business killing liabilities.

As compliance costs go UP for these companies.  The cost goes UP for consumers. The model is changed.

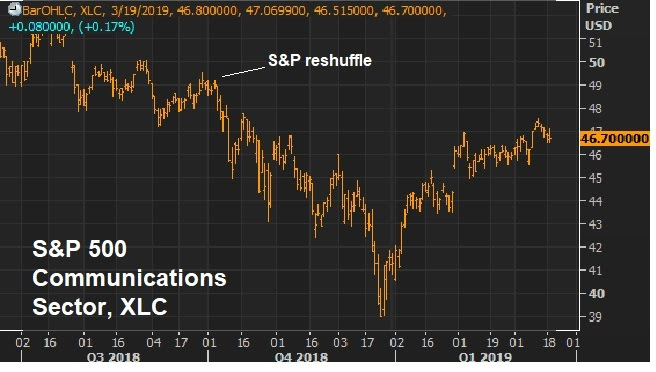
On a related note, remember, last September the S&P 500 reshuffled the big tech giants.  Among the changes, they moved Facebook, Google and Twitter out of the tech sector and in to the telecom sector (re-named the “Communications” sector”).

Here’s what that sector ETF looks like since …

Join me here to get my curated portfolio of 20 stocks that I think can do multiples of what broader stocks do, coming out of this market correction environment.

November 6, 5:00 pm EST

In my note yesterday, we talked about the probable outcomes for the elections.

Whether we see the Republican’s retain control of the house, or lose it, both scenarios should be a greenlight for stocks.

Why? Because the cloud of uncertainty will be lifted. Even if we were to have gridlock in Washington, from here forward, the economy has strong momentum already, and the benefits of fiscal stimulus and deregulation are still working through the system.

Now, given today’s midterm elections are feeling a bit like the Presidential election of 2016 (as a referendum on Trump, this time), I want to revisit my note from election day on November 8, 2016.

As I said at that time, central banks had been responsible for the global economic recovery of the prior nine years, and for creating and maintaining relative economic stability.  And creating the incentives to push money into the stock market (i.e. push stocks higher) played a big role in the coordinated strategies of the world’s biggest central banks.  With that, I said “neither the economic recovery, nor the stock market recovery can be credited much to politicians.  In this environment, in the long run, the value of the new President for stocks will prove out only if there’s structural change. And structural change can only come when the economy is strong enough to withstand the pain. And getting the economy to that point will likely only come from some big and successfully executed fiscal stimulus.

It turns out, Trump has indeed executed on fiscal stimulus.  And he’s gone aggressively after structural change too (perhaps too early, and with some success, but at a price he may pay for politically).  Still, he’s been able to execute ONLY because he’s had an aligned Congress.

Importantly, the economic policies out of Washington have allowed the Fed to bow-out of the game of providing life support to an economy that was nearly killed by the financial crisis.  That’s good!

November 5, 5:00 pm EST

The elections tomorrow are said to be a referendum on Trump’s Presidency.

And given the sentiment, I think it’s fair to say the surprise scenario for markets would be for Republicans to retain control of Congress.  For that to happen, it looks like the Republicans would need to win 61% of the “toss up” races in the house.  Of those, 84% are currently Republican held.

That scenario would be a vote of confidence for the Trump economic agenda.  And for markets, it would be “risk on,” which would likely draw more attention to the inflation outlook, and the speed at which market interest rates will move. Trump would retain his leverage over China on trade concessions.

Scenario two, would be a split Congress.  If we get a split Congress, the Trump economic plan would likely turn to infrastructure.  The belief is that a Democrat led house would likely be a partner to Trump on a big infrastructure spend.

Though I suspect, given the political atmosphere, they may work to block any further progress on the economic stimulus front, in effort to position themselves for the 2020 Presidential election.   On China trade negotiations, I suspect a split Congress would begin to fight against Trump’s executive order-driven trade wars.  This scenario would mean, gridlock in Washington.

However, after the cloud of election uncertain lifts, both scenarios should be a greenlight for stocks.

Remember, we already have an economy running north of 3%, with record low unemployment, and consumers are sitting on record high household net worth and record low debt service ratios.  Companies are growing earnings at over 20% (yoy), and growing revenues at over 8% (yoy).  And corporate credit market debt is near the lowest levels (relative to market value of corporate equities) of the past 70 years.

So there is plenty of fuel in the economy to continue the trajectory of economic boom.  Maybe most importantly, following the October correction, the tech giants have been pricing out the “monopoly scenario” which paves the way for a broader-based bull market for stocks.

Join me here to get all of my in-depth analysis on the big picture, and to get access to my carefully curated list of “stocks to buy” now.