Chinese Stocks Signaling Growth, Trade Dispute Is Bottoming
|
February 13, 5:00 pm EST
Over the past couple of days we’ve looked at some key technical levels for stocks, as we continue this V-shaped recovery from the deep decline of December.
We now sit just a percent and a half off of the December 3rd highs. And today, we get a break and a close above the 200-day moving average in the S&P 500.
So, with all of the doom and gloom scenarios we heard as we entered 2019, a month later and we’ve nearly fully recovered the losses of December. And with expectations on earnings and growth all ratcheted down now for the year, we have a lot of fuel for much higher stocks.
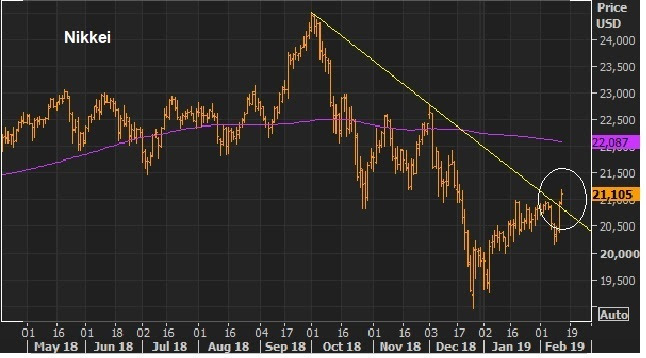
As U.S. stocks go, so do global stocks. We looked at the chart on Japanese stocks yesterday. We did indeed get a big technical break overnight of the correction downtrend that started in October of last year.
So, today we have this chart …
|
 |
With much of the concern on global growth directed squarely in China, this chart of Chinese stocks is signaling that perhaps Chinese growth is bottoming, and maybe because a U.S./China deal is coming.
|
In this chart above, you can see this bear market in Chinese stocks last year was started in January. That was when Trump rhetoric on a China trade war turned into action. He slapped tariffs on washing machines and solar panels (a signal of bark and bite). Now we have a bottom, as of last month, and a big technical break of the downtrend, arguably leading the patterns we’re seeing in U.S. and Japanese stocks. For how you can play it: Here are some ETFs that track Chinese stocks.
Join me here to get my curated portfolio of 20 stocks that I think can do multiples of what broader stocks do, coming out of this market correction environment.
|
|
|
|
|